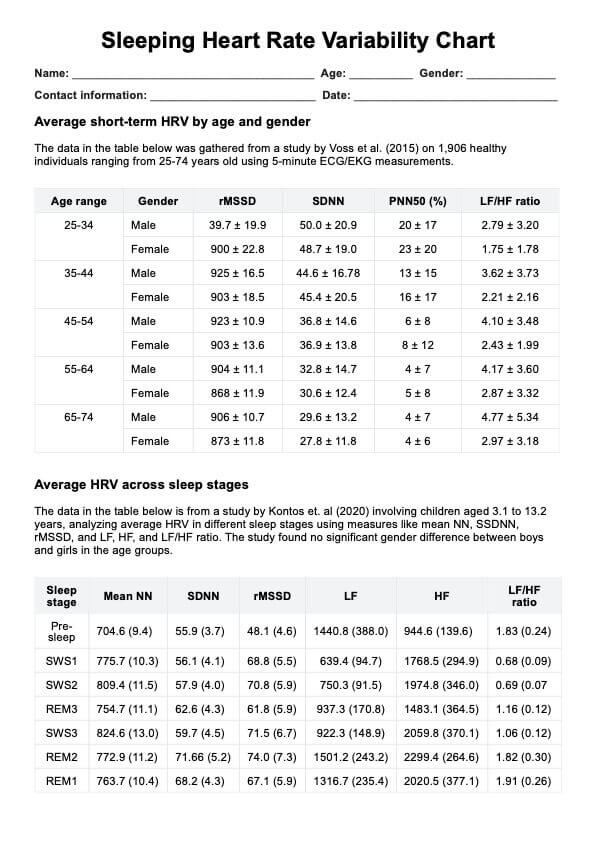
Sleeping Heart Rate Variability

Unlock insights into heart health with our Sleeping Heart Rate Variability Chart. Download the free PDF for comprehensive, easy-to-understand examples.

By Liliana Braun on Apr 08, 2024.

Fact Checked by Ericka Pingol.

Use Template

What Is a Sleeping Heart Rate Variability Chart?

A sleeping heart rate variability chart is valuable for assessing sleep quality and identifying potential health concerns. Heart rate variability (HRV) measures the variation in time between each heartbeat, and a higher HRV indicates a more relaxed and adaptable heart. A lower HRV suggests a more stressed and less flexible nature.

During sleep, your HRV typically follows a pattern, with lower HRV in lighter and higher HRV in deeper stages of sleep. Tracking your sleeping HRV can provide insights into your overall sleep quality and identify potential health concerns, such as sleep apnea, insomnia, or other sleep disorders.

To measure your sleeping HRV, you will need a sleep tracker or heart rate monitor to record your HRV throughout the night. Once you have your HRV data, you can use a sleep HRV chart to visualize your HRV patterns and identify potential health concerns. Tracking your sleeping HRV over time can help you identify patterns and adjust your sleep routine.

Comparing your HRV to the average HRV for your age group can give you a general idea of how your HRV is doing. If you have any concerns about your HRV, consulting with a healthcare professional can help you interpret your HRV data and make recommendations for improving your sleep quality.

Printable Sleeping Heart Rate Variability Chart PDF

Download our free Sleeping Heart Rate Variability Chart for a better night's sleep

How Does It Work?

Here are the steps involved with using a printable sleeping heart rate variability chart:

  1. Gather Your HRV Data: Before filling out the chart, collect your HRV data from a sleep tracker or heart rate monitor that can record your HRV throughout the night. Ensure your device is compatible with the chart's format and provides HRV readings for each sleep stage (NREM 1, NREM 2; NREM 3, and REM).
  2. Identify Your Sleep Stages: To accurately interpret your HRV data, you must identify the sleep stages you experienced throughout the night. This information can usually be obtained from a sleep tracker that tracks sleep stages. Alternatively, you may consult a sleep specialist or use sleep analysis tools to determine your sleep stages.
  3. Locate the HRV Ranges for Each Sleep Stage: The printable HRV chart should provide ranges for each sleep stage. These ranges represent the typical HRV values for each stage of sleep. For instance, NREM 1 sleep typically has a lower HRV range than REM sleep.
  4. Plot Your HRV Data: Once you have your HRV data and sleep stage information, you can plot your HRV data on the chart. Typically, the chart will have a horizontal axis representing the sleep stages and a vertical axis representing HRV values. Each sleep stage will have its own HRV curve.
  5. Analyze Your HRV Patterns: After plotting your HRV data, analyze the patterns to identify any abnormalities or trends. For example, consistently low HRV during sleep may indicate sleep apnea, while consistently high HRV may suggest inadequate restful sleep.
  6. Seek Professional Guidance: If you have concerns about your HRV patterns or overall sleep quality, book an appointment with a healthcare professional. They can help interpret your data, provide personalized recommendations, and address any underlying health issues affecting your sleep.

Sleeping Heart Rate Variability Chart Example (Sample)

Carepatron's Sleeping Heart Rate Variability Chart PDF is valuable for understanding your sleep health. It aids you in tracking your HRV throughout different stages of sleep and helps you identify potential health concerns. By downloading and plotting your HRV data on the chart, you can gain valuable insights into your sleep quality and overall well-being.

If you have concerns about your sleeping HRV, consult a healthcare professional. Carepatron is committed to providing user-friendly tools and resources to help you make informed decisions about your health.

Download our Sleeping Heart Rate Variability Chart Example PDF

Sleeping Heart Rate Variability Chart Example

When Would You Use This Chart?

A Sleeping Heart Rate Variability Chart is valuable for assessing sleep quality and identifying potential health concerns. Some specific times when this chart would be of use include:

  • Tracking Sleep Quality Over Time as the chart allows you to track your HRV patterns over time, enabling you to monitor changes in your sleep quality. This can be particularly beneficial if you are making lifestyle changes or using medication to try to help sleep disorders.
  • Identifying Potential Sleep Disorders as consistent irregularities in your HRV patterns, such as persistently low HRV during sleep, may indicate underlying sleep disorders like sleep apnea or insomnia. In this case, it can be beneficial to contact a healthcare professional to interpret your HRV data to take appropriate action.
  • Assessing cardiovascular health is essential because by tracking your HRV, you can gain insights into the adaptability of your heart and identify potential cardiovascular risks.
  • Monitoring Sleep Progress with Interventions. For example, if you are implementing interventions to improve your sleep, such as cognitive behavioral therapy for insomnia (CBT-I) or changes in your sleep environment, tracking your HRV can help you assess the effectiveness of these measures.

What Do the Results Mean?

Common results of the Free Sleeping Heart Rate Variability Chart include:

  • Having consistently high HRV throughout sleep stages may indicate that you need more deep, restorative sleep. This can lead to daytime fatigue, decreased cognitive function, and increased susceptibility to stress-related disorders.
  • If you are experiencing consistently low HRV throughout sleep stages, it may suggest underlying health issues, such as sleep apnea, insomnia, or other sleep disorders. For example, sleep apnea causes disruptions in breathing during sleep, leading to decreased HRV.
  • HRV naturally varies across sleep stages, with lower HRV values in more profound sleep stages and higher HRV values in lighter sleep stages. If your HRV falls within the normal ranges for each sleep stage, it indicates that your sleep pattern is generally healthy.
  • Irregular HRV patterns, such as sudden spikes or dips, may indicate underlying health conditions or sleep disturbances. Therefore, you must contact a healthcare professional if you observe irregular HRV patterns consistently.
  • Tracking your HRV over time can reveal trends in your sleep quality. For example, if you notice a gradual decline in HRV, it suggests a decline in sleep quality. Therefore, an upward trend in HRV indicates improvements in sleep health.

Why Use Carepatron as Your Sleeping Heart Rate Variability App?

​​Carepatron emerges as a leader in sleep health monitoring, offering the sleeping heart rate variability chart app and subsequent sleeping heart rate variability chart software that goes beyond simple tracking. It provides in-depth insights into your sleep patterns, offering personalized interpretations to identify underlying health or lifestyle factors affecting sleep quality.

The sleeping heart rate variability tracking chart allows recording values for each sleep stage, aiding in trend analysis. Carepatron ensures an intuitive and accessible user experience, simplifying the process of understanding heart rate variability and making informed decisions about sleep health. The sleeping heart rate variability chart seamlessly integrates into the user-friendly interface, offering a clear layout for easy progress tracking. 

With an unwavering commitment to data privacy and security, Carepatron employs advanced measures to safeguard personal health data. The HRV tracking template is embedded in a secure data storage system with encryption and access controls, ensuring confidentiality.

At the forefront of sleep science innovation, Carepatron continuously updates its heart rate variation app to reflect the latest advancements. The sleeping heart rate variation chart evolves with ongoing research, providing users with accurate and relevant information for effective self-monitoring. 

Empowering individuals to take control of their sleep health, Carepatron's sleeping heart rate variability app offers comprehensive data, personalized insights, and actionable recommendations. The chart is a powerful tool for self-monitoring, enabling users to identify areas for improvement and make informed decisions for optimal sleep quality and overall well-being.

EHR software benefit

References

Gouin, J., Wenzel, K., Deschenes, S., & Dang-Vu, T. (2013). Heart rate variability predicts sleep efficiency. Sleep Medicine, 14, e142. https://doi.org/10.1016/j.sleep.2013.11.321

Heart Rate Variability and Sleep - Amerisleep. (n.d.). Amerisleep.com. https://amerisleep.com/blog/heart-rate-variability-and-sleep/

Sajjadieh, A., Shahsavari, A., Safaei, A., Penzel, T., Schoebel, C., Fietze, I., Mozafarian, N., Amra, B., & Kelishadi, R. (2020). The Association of Sleep Duration and Quality with Heart Rate Variability and Blood Pressure. Tanaffos, 19(2), 135–143. https://www.ncbi.nlm.nih.gov/pmc/articles/PMC7680518/

Who typically requests a Sleeping Heart Rate Variability Chart?

Commonly asked questions

Who typically requests a Sleeping Heart Rate Variability Chart?

Sleeping Heart Rate Variability Charts are typically requested by individuals concerned about their sleep quality or who have been diagnosed with a sleep disorder, such as sleep apnea or insomnia. Healthcare professionals may also request them to monitor a patient's sleep health or assess a sleep intervention's effectiveness.

When are Sleeping Heart Rate Variability Charts used?

Sleeping Heart Rate Variability Charts are used to assess sleep quality by measuring the variation in time between each heartbeat during sleep. This variation is known as heart rate variability (HRV), a measure of the adaptability of the heart. Lower HRV is associated with poorer sleep quality, while higher HRV is associated with better sleep quality.

How are Sleeping Heart Rate Variability Charts used?

Sleeping Heart Rate Variability Charts can be used to track HRV over time to identify trends in sleep quality. They can also be used to compare HRV values to normal ranges to assess whether a person's sleep quality is within the normal range.

How long does a Sleeping Heart Rate Variability Chart take?

The time it takes to create a Sleeping Heart Rate Variability Chart depends on the method used to measure HRV. Some methods, such as electrocardiography (ECG), require a sleep study, which can take several hours to complete. Other methods, such as wearable devices, can track HRV continuously to generate a chart in real-time.

Join 10,000+ teams using Carepatron to be more productive

One app for all your healthcare work