Insulin levels can fluctuate throughout the day based on food intake, physical activity, stress, and other factors. This is why fasting insulin levels are measured after an 8-12 hour fast to provide a consistent baseline for assessing normal blood sugar levels.
Fasting Insulin Levels
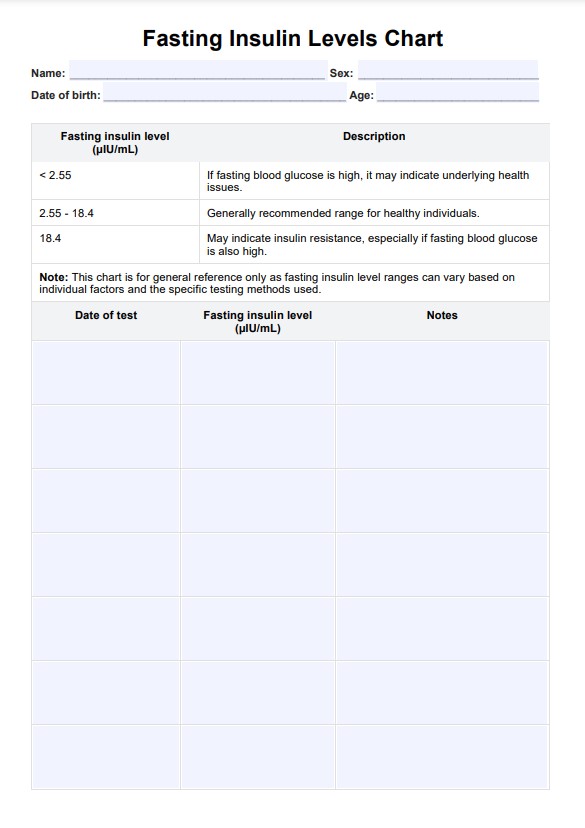
Fasting Insulin Levels Chart - a vital tool for healthcare practitioners. Understand its clinical importance in managing insulin and optimizing patient care.

Use Template
Fasting Insulin Levels Template
Commonly asked questions
In addition to fasting insulin, tests for high blood sugar, such as fasting blood glucose, hemoglobin A1C (HbA1c), fructosamine, and c-peptide, are commonly used to evaluate both high blood glucose, sugar control, and insulin function.
Lifestyle factors such as diet, physical activity, stress management, and sleep quality significantly influence fasting insulin levels. A diet high in refined sugars and carbohydrates can increase insulin levels, while regular exercise and a balanced diet help maintain healthy plasma glucose levels and normal blood sugar level.


EHR and practice management software
Get started for free
*No credit card required
Free
$0/usd
Unlimited clients
Telehealth
1GB of storage
Client portal text
Automated billing and online payments