Fasting Insulin Levels

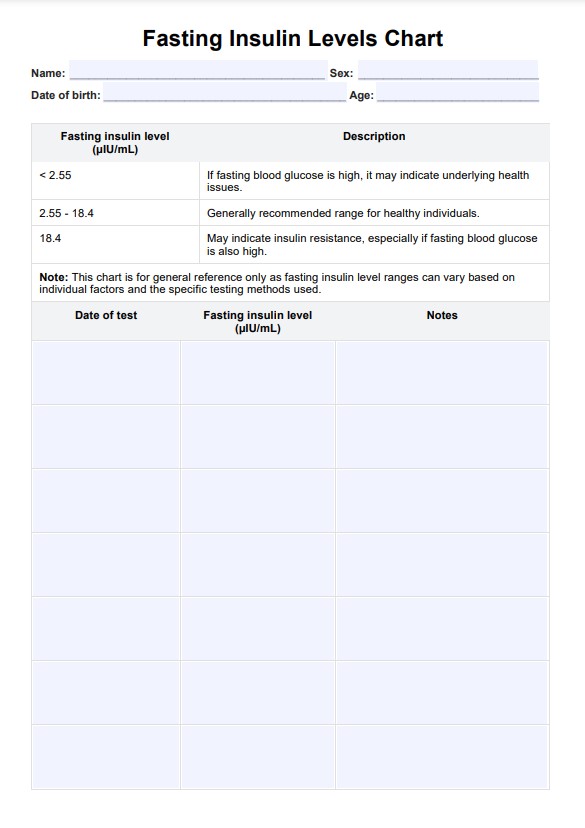
Fasting Insulin Levels Chart - a vital tool for healthcare practitioners. Understand its clinical importance in managing insulin and optimizing patient care.

�?�

By Olivia Sayson on Apr 08, 2024.

Fact Checked by RJ Gumban.

Use Template

What is a Fasting Insulin Levels Chart?

Insulin, a hormone secreted by the pancreas's beta cells, is crucial in regulating blood glucose levels. When you consume food, your digestive system breaks down carbohydrates into glucose, which enters your bloodstream. Elevated blood sugar levels trigger insulin release from the pancreas, facilitating the transfer of glucose from the blood into cells, predominantly muscle and fat tissue. It also directs glucose into the liver, storing it as glycogen for future energy needs.

The fasting insulin test assesses your insulin levels following a minimum 8-hour fast. A healthcare practitioner will draw a blood sample from a vein and send it to a lab for analysis. Other tests to evaluate blood sugar and insulin levels include fasting blood glucose, hemoglobin A1C (HbA1c), fructosamine, and c-peptide.

Fasting insulin is a critical, yet sometimes underestimated, assessment that can aid in identifying insulin resistance. When individuals experience insulin resistance, cells in the body, such as those in skeletal muscle, do not respond normally to insulin and are less able to manage glucose levels. This results in an increase of blood glucose, which poses risk factors for chronic conditions like high blood pressure, type 2 diabetes mellitus and heart disease.

It's important to note that insulin levels may become imbalanced long before any abnormalities in blood sugar levels are evident. Therefore, even if your blood sugar test results appear normal, you might still be experiencing insulin resistance and high blood sugar levels.

As a healthcare practitioner, you understand the critical role of monitoring insulin levels in managing and optimizing patient care. In this regard, the Fasting Insulin Levels Chart is an invaluable resource.

Printable Fasting Insulin Levels Chart

Download this Fasting Insulin Levels Chart, which assesses your insulin levels following a minimum 8-hour fast.

How does it work?

For healthcare practitioners, having access to a well-structured and comprehensive Printable Fasting Insulin Levels Chart is essential. It simplifies the process of tracking insulin levels and supports evidence-based care.

Step 1: Obtain a template

Start by acquiring the reliable Fasting Insulin Levels Chart template for healthcare professionals from this page or Carepatron's template library.

Step 2: Record patient data

Enter the patient's fasting insulin levels, ensuring precision in noting the values, test date, and pertinent clinical information. Accurate and detailed record-keeping is crucial for treatment planning and evaluation.

Step 3: Interpretation and clinical insights

Specify the test date and provide a clinical interpretation of the insulin levels. Use this information to make informed decisions about the patient's condition and treatment plan, whether it involves lifestyle modifications or medication adjustments.

Step 4: Developing a patient-centered plan

In this step, outline a personalized care plan based on the patient's results. This may involve tailoring dietary recommendations, exercise routines, or medication regimens to improve insulin resistance levels and overall health.

Fasting Insulin Levels Chart example (sample)

Our Fasting Insulin Levels Chart PDF includes example responses, offering step-by-step instructions for its use. Whether you're an experienced practitioner or new, we've designed this resource to empower you.

Integrate the Fasting Insulin Levels Chart into your practice to enhance patient care and contribute to better health outcomes. At Carepatron, we're here to support you every step of the way, and this chart is just one of the tools we offer to help you excel in your clinical practice.

Download this Fasting Insulin Levels Chart Example: 

Fasting Insulin Levels Chart Example (sample)

When should you use the Fasting Insulin Levels Chart? 

The Fasting Insulin Levels Chart proves to be a versatile and indispensable tool in various healthcare scenarios where precise monitoring of insulin levels is of utmost importance. It plays a pivotal role in diabetes management, facilitating the regular tracking of fasting insulin levels and enabling healthcare practitioners to make more effective adjustments to a patient's diabetes treatment plan. 

This chart extends its value to individuals with metabolic disorders such as metabolic syndrome and polycystic ovary syndrome (PCOS), providing a structured approach to assessing insulin dynamics and helping to optimize treatment strategies. 

For patients embarking on journeys of weight management and those seeking to improve their metabolic health, the Fasting Insulin Levels Chart serves as a valuable ally, aiding in evaluating insulin sensitivity and guiding the formulation of tailored lifestyle changes like implementing a healthy diet. It also serves as an invaluable resource in routine health check-ups, enhancing the comprehensiveness of patient assessments by contributing insights into their insulin health.

This proactive approach to patient care caters to a spectrum of healthcare needs with precision and efficacy.

What do the results mean?

Our free fasting insulin levels chart is a structured visual representation, presented in a tabular format, that provides a comprehensive overview of the range of normal fasting insulin levels for individuals across various ages and genders. This chart serves as a valuable diagnostic and assessment tool in healthcare. Its primary purpose is establishing a clear reference range for fasting insulin levels, crucial for understanding and interpreting an individual's insulin status.

A typical result within the normal range suggests that the patient's insulin levels are well-regulated, indicating good overall health. However, an atypical result may mean issues with insulin sensitivity or potential risks for conditions like gestational diabetes, diabetes mellitus, or cardiovascular disease. In this case, health practitioners such as doctors and health coaches should complete further assessments like an oral glucose tolerance test or blood test to gain more information. These results may then be used to guide interventions such as dietary changes, exercise recommendations, or medication adjustments.

In cases where results are inconclusive, a comprehensive evaluation is necessary, considering the patient's medical history and specific circumstances to make informed decisions.

Who typically requests a Fasting Insulin Levels Chart?

Commonly asked questions

Who typically requests a Fasting Insulin Levels Chart?

Fasting Insulin Levels Charts are typically requested by healthcare practitioners, such as doctors, endocrinologists, or registered dietitians, who need to monitor and assess the insulin levels of their patients.

When are Fasting Insulin Levels Charts used?

These charts are often used to manage diabetes, metabolic disorders, weight-related issues, and general health assessments.

�?�

How are Fasting Insulin Levels Charts used?

The fasting insulin levels are then compared to a reference range on the chart. Depending on the results, healthcare practitioners can assess insulin health, detect anomalies, and make informed decisions about treatment strategies, lifestyle modifications, or further diagnostic testing.

Join 10,000+ teams using Carepatron to be more productive

One app for all your healthcare work