What is a Hormone Cycle Chart?

A Hormone Cycle Chart is a detailed graphical representation that maps out the intricate dance of hormones throughout a menstrual cycle. It is a crucial educational and diagnostic tool, providing insights into the ebb and flow of hormones that orchestrate the menstrual cycle's various stages. By plotting the levels of estrogen, progesterone, follicle-stimulating hormone (FSH), and luteinizing hormone (LH), the chart offers a window into the body's endocrine system and its role in reproductive health.

The chart breaks down the menstrual cycle into four distinct phases:

  1. Menstrual Phase: Beginning with day one of menstruation, hormone levels are at their lowest, marking the shedding of the uterine lining.
  2. Follicular Phase: FSH rises, stimulating follicle development and increasing estrogen, which thickens the uterine lining.
  3. Ovulation Phase: A surge in LH triggers the release of an egg from the ovary, with estrogen peaking just before ovulation.
  4. Luteal Phase: Post-ovulation, progesterone dominates to maintain the uterine lining, preparing for potential pregnancy.

Understanding these hormonal patterns is vital for individuals tracking fertility, managing symptoms of hormonal imbalance, or seeking to understand their reproductive health better. For healthcare professionals, the chart is indispensable for diagnosing conditions like PCOS, PMS, or potential fertility issues. It can also guide the management of hormonal therapies and contraceptive choices.

A Hormone Cycle Chart is more than just a diagram; it's a narrative of a person's reproductive story, providing clues to their overall well-being and offering a foundation for informed health decisions.

Check out our free Hormone Cycle Chart here

Download our Hormone Cycle Chart PDF

How Does It Work?

A Hormone Cycle Chart is a dynamic tool that maps out the hormonal ebbs and flows during a menstrual cycle. Here's how it functions:

Step 1: Identify the Phases of the Cycle

The chart delineates the menstrual cycle into distinct phases: menstrual, follicular, ovulation, and luteal. Each phase is marked by unique hormonal activities crucial for reproductive processes.

Step 2: Track Hormonal Fluctuations

Estrogen, progesterone, FSH, and LH levels are plotted throughout the cycle. The chart visually captures the hormonal surge and decline, providing a clear picture of each phase's hormonal profile.

Step 3: Correlate with Physical Changes

The chart helps correlate hormonal levels with physical symptoms such as cramps, mood swings, and ovulation pain. By tracking these changes, one can understand how hormones influence physical well-being throughout the cycle.

Step 4: Use for Health Management

It serves as a predictive tool for ovulation, aiding in fertility planning or contraception. The chart is also instrumental in managing and anticipating symptoms of hormonal imbalances, such as in conditions like PCOS or menopause.

Step 5: Printable Hormone Cycle Chart

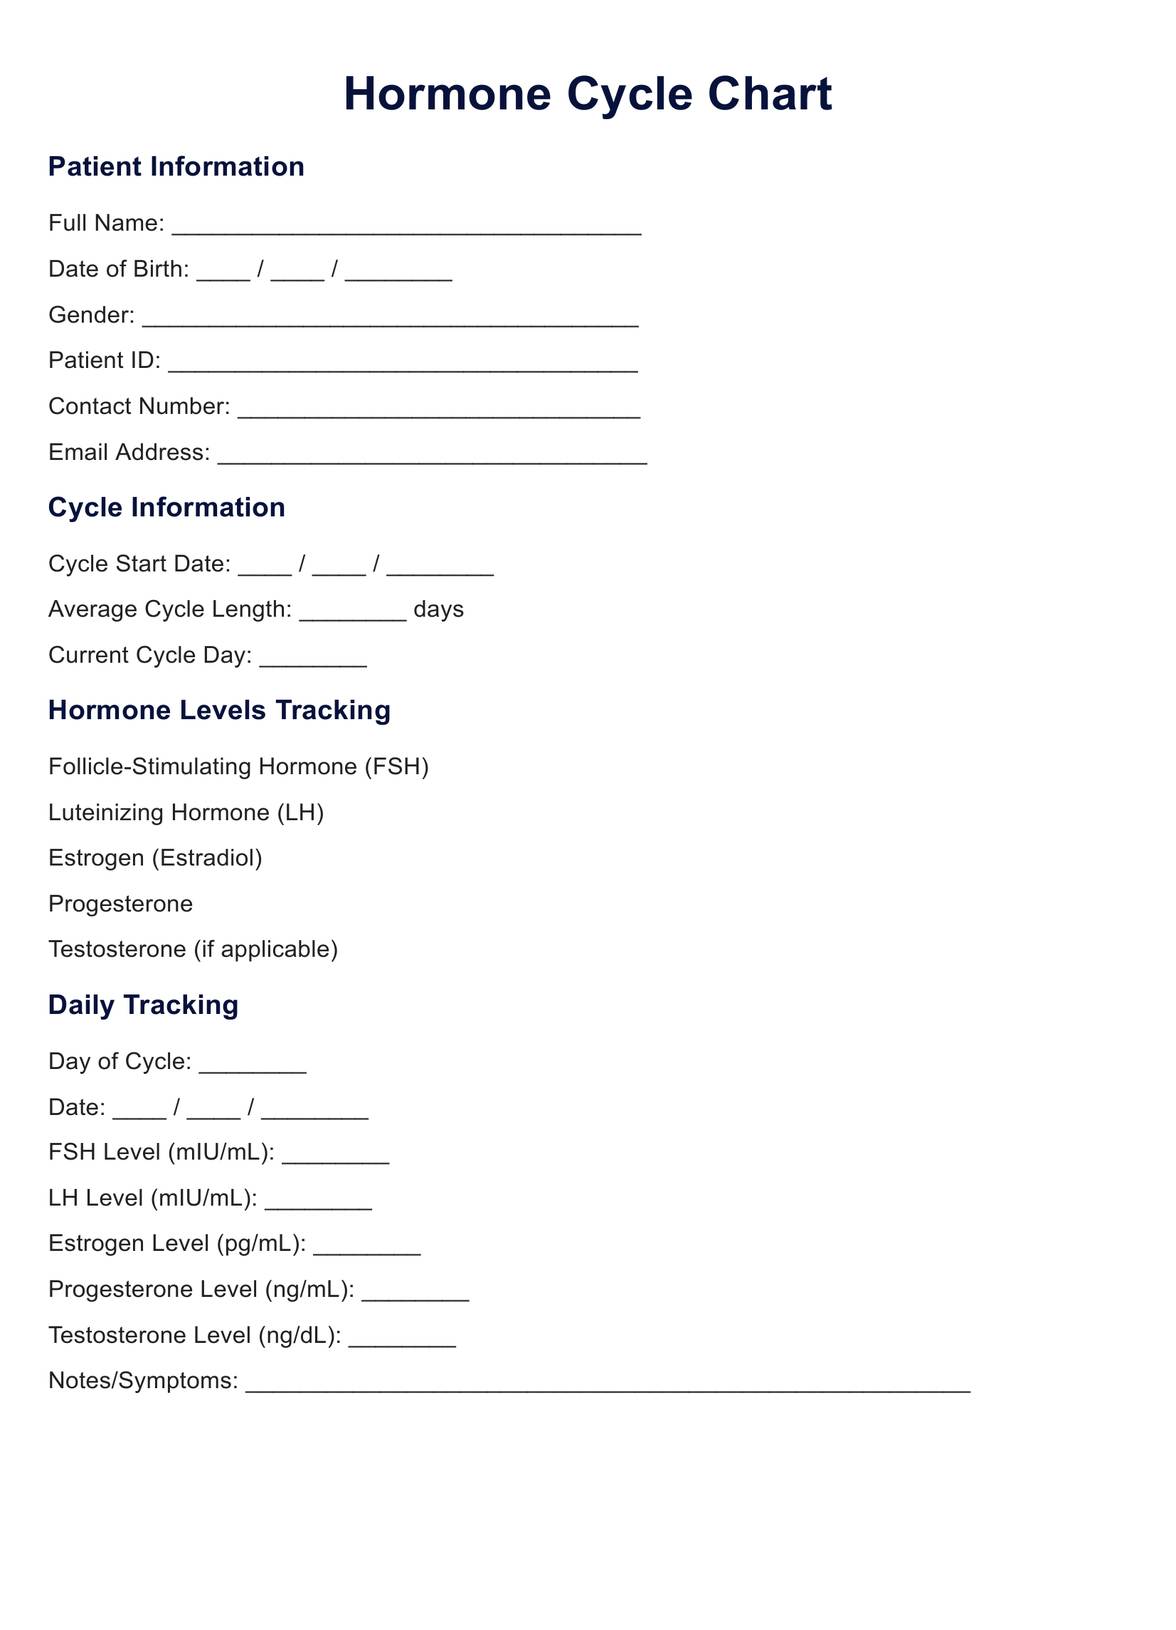
A printable chart version can be a convenient reference for daily tracking and long-term pattern observation. It allows for personal annotations and can be shared with healthcare providers for more personalized medical advice.

Our printable Hormone Cycle Chart is a comprehensive guide that not only informs but also empowers individuals to manage and optimize their hormonal health actively.

Hormone Cycle Chart Example (Sample)

A standard Hormone Cycle Chart example illustrates the hormonal journey across a typical 28-day menstrual cycle. It visually represents the interplay between key hormones:

  • Estrogen starts at a low level, peaks just before ovulation, and dips before the menstrual phase begins.
  • Progesterone remains low during the follicular phase, surges post-ovulation during the luteal phase, and drops if pregnancy does not occur.
  • FSH initiates the follicular phase, encouraging the growth of ovarian follicles, and its levels fall as estrogen rises.
  • LH spikes mid-cycle to trigger ovulation, showcased as a sharp peak on the chart.

The chart may also highlight when symptoms like premenstrual syndrome (PMS), ovulation cramps, or potential fertility windows occur. Mood fluctuations are often plotted to correspond with hormonal changes, providing insight into the emotional landscape during the cycle.

For a practical and user-friendly approach, a downloadable Hormone Cycle Chart PDF is available. This printable chart enables individuals to track their unique cycle, compare it with the standard cycle, and discuss any significant deviations with healthcare professionals.

Download our free Hormone Cycle Chart PDF

Hormone Cycle Chart Example (Sample)

When Would You Use This Chart?

A Hormone Cycle Chart is a versatile tool employed in several contexts:

  • Personal Health Monitoring: Individuals use this chart to track their menstrual cycle, noting patterns or irregularities. It's particularly useful for those experiencing symptoms like irregular periods, heavy bleeding, or premenstrual syndrome (PMS) and for those monitoring their cycle for natural family planning.
  • Fertility Planning: Couples trying to conceive may use the chart to identify the most fertile days. Conversely, it can also aid in natural contraception methods by indicating less fertile periods.
  • Healthcare Diagnosis and Treatment: Medical professionals utilize hormone cycle charts to diagnose conditions like polycystic ovary syndrome (PCOS), endometriosis, or early menopause. It aids in understanding the patient's cycle and tailoring treatments for hormonal imbalances.
  • Wellness and Lifestyle Adjustments: The chart can guide individuals to adapt their exercise, diet, and stress management techniques according to the different phases of their cycle to optimize well-being.
  • Research and Education: Researchers studying the effects of the menstrual cycle on various health conditions, such as migraine patterns or mood disorders, use these charts for data collection and analysis. It's also a valuable educational resource for teaching about reproductive health.

The Hormone Cycle Chart is appropriate for anyone seeking a deeper understanding of the menstrual cycle's role in overall health and well-being. It's a foundational resource for enhancing reproductive health literacy and empowering informed health decisions.

EHR software positive feedback

What Do The Results Mean?

Interpreting the results from a Hormone Cycle Chart involves understanding the normal hormonal fluctuations and recognizing deviations that might indicate health issues:

Normal Cyclical Patterns

A typical hormone cycle chart will show a rise in estrogen during the first half of the cycle (follicular phase), peaking just before ovulation. After ovulation, progesterone levels rise during the luteal phase, preparing the body for potential pregnancy. If no pregnancy occurs, both hormone levels drop, leading to menstruation.

Indicators of Hormonal Imbalance

Deviations from the expected patterns, such as consistently low progesterone or unusually high estrogen levels, can suggest hormonal imbalances. These imbalances may manifest as symptoms like irregular cycles, heavy or light menstrual bleeding, or premenstrual dysphoric disorder (PMDD).

Signs of Specific Conditions

  • PCOS: The chart may show consistently high levels of estrogen with a lack of ovulation indicated by absent or low progesterone peaks.
  • Thyroid Disorders: Abnormal levels of sex hormones on the chart could also hint at thyroid issues, given the thyroid's role in regulating overall metabolism and hormone balance.
  • Perimenopause: Fluctuating and overall declining hormone levels could indicate the transition to menopause.

Predictive Use

For those tracking fertility, a consistent pattern of ovulation indicated by a mid-cycle estrogen peak followed by a rise in progesterone can suggest a higher likelihood of fertility.

Understanding the results of our Free Hormone Cycle Chart can guide individuals and healthcare providers in making informed decisions about further diagnostic testing, lifestyle modifications, or treatment options. It's a critical step in managing reproductive health and addressing concerns related to menstrual and hormonal health.

Why Use Carepatron as Your Hormone Cycle App?

Simplicity and Efficiency

Carepatron is designed with simplicity at its core, ensuring you can start tracking your hormone cycle without a steep learning curve. The intuitive interface means more time focusing on health insights and less on navigating the software.

Comprehensive Compliance

With robust compliance to global standards like HIPAA, GDPR, and HITRUST, Carepatron guarantees that your sensitive health data is handled with the utmost security and confidentiality.

Collaborative Care

The platform fosters collaboration, allowing healthcare teams to share information effortlessly. Whether you're consulting with a specialist or updating your healthcare provider, Carepatron makes communication as straightforward as if you were face-to-face.

Global Trust

Serving a worldwide community, Carepatron is a trusted name in practice management. The commitment to delivering a superior experience is evident in the positive feedback from a diverse user base.

Integrated Tools

With features like patient portal software, healthcare payment software, and patient appointment reminder software, the app streamlines various aspects of healthcare management.

Advanced Features

Utilize medical dictation software for efficient clinical note-taking and manage finances easily using medical billing software.

Scheduling Made Easy

The healthcare scheduling software systems feature ensures that appointments are organized, and reminders are set, minimizing missed consultations.

Documentation Excellence

Carepatron's clinical documentation software aids in maintaining meticulous records, which is essential for accurate hormone cycle tracking and health monitoring.

Carepatron is more than just a Hormone Cycle Chart app; it's a comprehensive solution that empowers you to take control of your hormonal health with confidence and ease.

EHR software benefit

References

Dalton, K. (1964). The premenstrual syndrome. Springfield, IL: Charles C. Thomas Publisher.

Azziz, R., Woods, K. S., Reyna, R., Key, T. J., Knochenhauer, E. S., & Yildiz, B. O. (2004). The prevalence and features of the polycystic ovary syndrome in an unselected population. The Journal of Clinical Endocrinology & Metabolism, 89(6), 2745-2749.

Schmidt, P. J., Steinberg, E. M., & Rubinow, D. R. (2017). PMDD: Deadly disorder or disease of the moment? American Journal of Psychiatry, 174(2), 120-126.

Mira, T. A., Bueno, A. F., Borges, V. T., Yela, D. A., Benetti-Pinto, C. L., & Poli-Neto, O. B. (2019). Digital health and the menstrual cycle: A scoping review. International Journal of Medical Informatics, 125, 79-87.

Fehring, R. J., Schneider, M., & Raviele, K. (2006). Variability in the phases of the menstrual cycle. Journal of Obstetric, Gynecologic & Neonatal Nursing, 35(3), 376-384.

Who typically requests a Hormone Cycle Chart?

Commonly asked questions

Who typically requests a Hormone Cycle Chart?

Individuals tracking menstrual health, healthcare providers, and researchers.

When are Hormone Cycle Charts used?

For menstrual health management, fertility planning, and diagnosis of hormonal conditions.

How are Hormone Cycle Charts used?

To track and analyze hormonal fluctuations throughout the menstrual cycle.

How long does a Hormone Cycle Chart take?

It is an ongoing process that tracks the menstrual cycle over several months for accuracy.

Join 10,000+ teams using Carepatron to be more productive

One app for all your healthcare work