ABG Interpretation ChartAI Template IconToolbar IconShare Icon

ABG Interpretation Chart

Discover ABG Interpretation Charts, essential tools for healthcare pros to evaluate acid-base balance, oxygenation, and ventilation in patient care.

Joshua Napilay avatar

By Joshua Napilay on Aug 2, 2025.

Fact Checked by Ericka Pingol.

Use Template

What is an ABG Interpretation Chart?

An Arterial Blood Gas (ABG) Interpretation Chart is a structured clinical tool that guides healthcare professionals through the process of analyzing arterial blood gas results. It ensures a systematic approach to evaluating a patient’s acid-base balance, oxygenation, and ventilation status—key factors in diagnosing and managing respiratory and metabolic disorders, including acid base disorders.

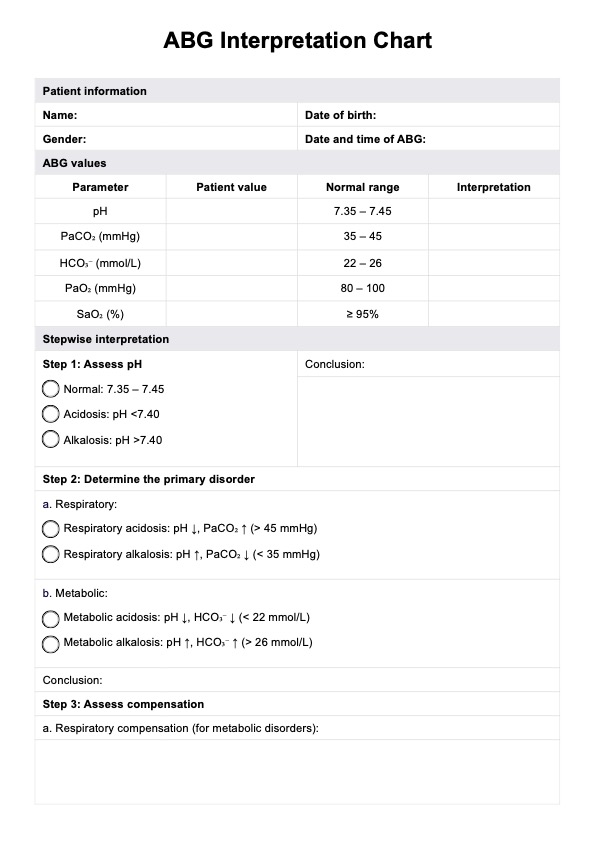
The chart is designed to capture both raw ABG values and clinical interpretations in one place, streamlining blood gas interpretation and supporting clinical decision-making. The core parameters assessed include blood pH, PaCO₂, HCO₃⁻, PaO₂, and SaO₂. The chart also provides normal reference ranges alongside fields for entering patient values and space for interpretive notes, helping clinicians quickly spot abnormalities.

Interpretation of arterial blood gases using this chart follows a stepwise method:

  • Assess pH: The chart prompts clinicians to first determine if the patient is acidotic, alkalotic, or within normal pH range.
  • Determine the primary disorder: By analyzing the relationship between blood pH, PaCO₂, and HCO₃⁻, clinicians can classify the disorder as respiratory or metabolic in origin.
  • Assess metabolic compensation: The chart includes dedicated fields to evaluate whether the body is compensating (fully, partially, or not at all) through respiratory or metabolic mechanisms.
  • Assess oxygenation: Clinicians also document and interpret PaO₂ and SaO₂ values to assess oxygenation status and detect hypoxemia.

Additionally, the chart incorporates space for a summary of interpretation, key notes to reinforce learning points, and healthcare professional identification to document accountability.

Many modern electronic health record (EHR) systems include similar structured templates, allowing clinicians to integrate arterial blood gas interpretation seamlessly into patient records and treatment workflows.

This ABG Interpretation Chart not only supports accurate, consistent blood gas interpretation but also fosters clear communication among members of the healthcare team—helping to improve patient care in both emergency and routine settings.

ABG Interpretation Chart Template

Download PDF Template

How does it work?

A printable ABG Interpretation Chart Template is a convenient resource for healthcare professionals to quickly and accurately interpret arterial blood gas values. After clicking on "Use template" or "Download" to access the template, you can follow these steps:

Step 1: Assess the acid-base status

Begin by determining if the patient's blood pH value falls within the normal range (7.35-7.45). A value below this range signifies acidosis (metabolic acidosis or respiratory acidosis), while above indicates alkalosis (metabolic alkalosis or respiratory alkalosis).

Step 2: Identify the primary disorder

Next, analyze the PaCO2 and HCO3- levels to establish whether the primary disorder is respiratory or metabolic. An abnormal PaCO2 value implies a respiratory disorder (such as acute respiratory alkalosis, chronic respiratory alkalosis, or acute respiratory acidosis), whereas an abnormal HCO3- value suggests a metabolic disorder.

Step 3: Determine the presence of compensation

Investigate if the body is attempting to rectify the imbalance by examining the primary disorder's opposite component (PaCO2 or HCO3-). If this value is also abnormal, compensation is likely taking place. For example, in partially compensated metabolic alkalosis or concurrent metabolic alkalosis, compensation patterns will be evident.

Step 4: Assess oxygenation and ventilation

Evaluate the patient's oxygenation status by inspecting the PaO2 and SaO2 values. Low PaO2 or SaO2 levels could indicate hypoxemia, offering more insight into respiratory failure or other underlying conditions.

Step 5: Record your findings

Once you have interpreted the arterial blood gas values, document your conclusions on the printable chart template to facilitate easy reference and communication with fellow healthcare professionals.

When would you use this template?

This template is a versatile and practical resource that can be employed in various clinical situations by various healthcare professionals, including physicians, nurses, respiratory therapists, and other practitioners involved in patient care. Here are some appropriate situations and contexts in which this template can be utilized effectively.

Diagnosing respiratory and metabolic disorders

The ABG Interpretation Chart Template is particularly useful when evaluating patients presenting with signs and symptoms of respiratory or metabolic disorders. By analyzing arterial blood gas results, healthcare professionals can determine the primary cause of the acid-base imbalance and make accurate diagnoses, including identifying elevated HCO₃, normal anion gap, or diabetic ketoacidosis.

Monitoring critically ill patients

In intensive care units (ICUs) and emergency departments, the chart template plays a crucial role in monitoring the condition of critically ill patients. Regular assessment of arterial blood gas values helps identify changes in a patient's acid-base balance, oxygenation, and ventilation status, enabling timely interventions and adjustments to treatment plans.

Evaluating the effectiveness of treatments

Healthcare professionals may use the chart template to assess the efficacy of therapeutic interventions for respiratory and metabolic disorders. By comparing pre- and post-treatment ABG values, practitioners can determine if the chosen treatment—such as supplemental oxygen or correction of electrolyte disorders—is successfully addressing the underlying disorder or if adjustments are necessary.

Training and education

The ABG Interpretation Chart Template is a valuable educational tool for medical students, nursing students, and other healthcare professionals in training. By practicing with the template, learners can develop a strong foundation in blood gas interpretation, an essential skill for future clinical practice.

Quick reference in clinical settings

The template can be easily accessed as a quick reference guide during patient encounters. Its concise format helps healthcare professionals efficiently interpret arterial blood gas values and make informed decisions regarding patient care, such as whether to perform arterial blood sample collection from the radial artery or adjust ventilator settings.

Benefits

Using this template in your practice can also have the following advantages:

Improved accuracy in diagnosis

Free ABG Interpretation Charts provide healthcare professionals with a systematic and organized approach to analyzing arterial blood gas values, leading to more accurate diagnoses of respiratory and metabolic disorders.

Enhanced clinical decision-making

By offering clear guidelines and normal values for key parameters, the chart supports healthcare professionals in making informed decisions regarding patient care, including treatment selection and adjustments for acid base disturbances.

Time-efficient assessment

The concise format lets practitioners quickly and efficiently interpret arterial blood gas values, saving valuable time in busy clinical settings such as ICUs, emergency departments, and other patient care areas.

Accessible learning and training tool

It is an excellent educational resource for medical students, nursing students, and other healthcare professionals in training. By practicing with the chart, learners can develop a strong foundation in arterial blood gas interpretation, an essential skill for future clinical practice.

Cost-effective resource

Being free of charge, ABG Interpretation Charts offer an affordable option for healthcare professionals to access a valuable resource without incurring additional costs, making it accessible to a wider range of practitioners.

Easy to access and share

The charts are often available in printable PDF formats, making them easy to access, share, and use during patient encounters or as a quick reference guide in various clinical settings.

Research & evidence

The history of ABG analysis dates back to the early 20th century, with significant advancements in understanding acid-base balance, carbon dioxide, carbonic acid, and respiratory physiology (Severinghaus, 2002). The development of ABG Interpretation Charts as a resource for healthcare professionals has been influenced by decades of research, clinical practice, and technological advancements in blood gas analysis.

Over time, further research expanded upon the knowledge of acid-base balance, anion gap, and respiratory physiology (Hopkins et. al., 2022). In 1917, Donald D. Van Slyke of the Rockefeller Institute for Medical Research developed the gasometric technique to measure the total carbon dioxide and oxygen content in blood (Kofstad, 2012). Initially employing a volumetric approach, he later enhanced the method seven years later by adopting a manometric measurement system.

Poul Astrup (1915–2000) devised an innovative technique that leveraged the linear correlation between blood pH and the logarithm of PCO₂ (Huttmann, 2014). This approach enabled the first direct measurement of blood pH. By using two distinct gas concentrations and plotting them against log PCO₂, Astrup was able to determine the PCO₂ corresponding to the original pH by analyzing the line drawn between the two resulting pH points.

As the understanding of acid-base balance and respiratory physiology evolved, so did the need for a systematic approach to interpreting ABG values (Puri et. al., 2010). In response, medical professionals developed various methods and algorithms to guide the interpretation of arterial blood gas results. These methods formed the basis for the ABG Interpretation Charts that are used today.

Numerous studies have demonstrated the benefits of using structured approaches like ABG Interpretation Charts in clinical practice. Research has shown that these resources improve the accuracy of diagnoses, enhance clinical decision-making, and support the ongoing education of healthcare professionals.

References

Hopkins, E., Sharma, S., & Sanvictores, T. (2022, September 12). Physiology, acid base balance. National Library of Medicine; StatPearls Publishing. https://www.ncbi.nlm.nih.gov/books/NBK507807/

Huttmann, S. E., Windisch, W., & Storre, J. H. (2014). Techniques for the measurement and monitoring of carbon dioxide in the blood. Annals of the American Thoracic Society, 11(4), 645–652. https://doi.org/10.1513/annalsats.201311-387fr

Kofstad, J. (2012, October). 100 years of blood gas and acid base analysis in clinical medicine. Acutecaretesting.org. https://acutecaretesting.org/en/articles/100-years-of-blood-gas-and-acid-base-analysis-in-clinical-medicine

Puri, S., Paul, G., & Sood, P. (2010). Interpretation of arterial blood gas. Indian Journal of Critical Care Medicine, 14(2), 57–64. https://doi.org/10.4103/0972-5229.68215

Severinghaus, J. (2002, October). The invention and development of the blood gas analysis apparatus. Acutecaretesting.org. https://acutecaretesting.org/en/articles/the-invention-and-development-of-the-blood-gas-analysis-apparatus

Commonly asked questions

ABG (Arterial Blood Gas) Interpretation Charts are primarily used by healthcare professionals such as physicians, nurses, respiratory therapists, and medical students. They help these professionals assess a patient's acid-base status, oxygenation, and ventilation to make informed decisions about diagnosis and treatment.

ABG Interpretation Charts are used in various clinical situations, including:

  • Monitoring critically ill patients in intensive care units (ICUs)
  • Evaluating respiratory function in patients with lung diseases, such as asthma or chronic obstructive pulmonary disease (COPD)
  • Assessing acid-base imbalances in patients with metabolic disorders or kidney diseases
  • Evaluating the effectiveness of treatments, such as mechanical ventilation or oxygen therapy

Completed ABG Interpretation Charts should be stored securely in the patient's electronic medical record (EMR) or paper chart, following the healthcare facility's data privacy and storage protocols. It is essential to maintain accurate records of ABG results and their interpretations for future reference and to monitor treatment progress.

EHR and practice management software

Get started for free

*No credit card required

Free

$0/usd

Unlimited clients

Telehealth

1GB of storage

Client portal text

Automated billing and online payments