


What is an ABG Chart?
An ABG chart is a valuable tool used by healthcare professionals for assessing and deciphering arterial blood gas (ABGC) values. This comprehensive resource offers crucial insights into a patient's oxygenation levels, respiratory function, and acid-base equilibrium. These pieces of information can help one diagnose and manage diverse metabolic and respiratory disorders.
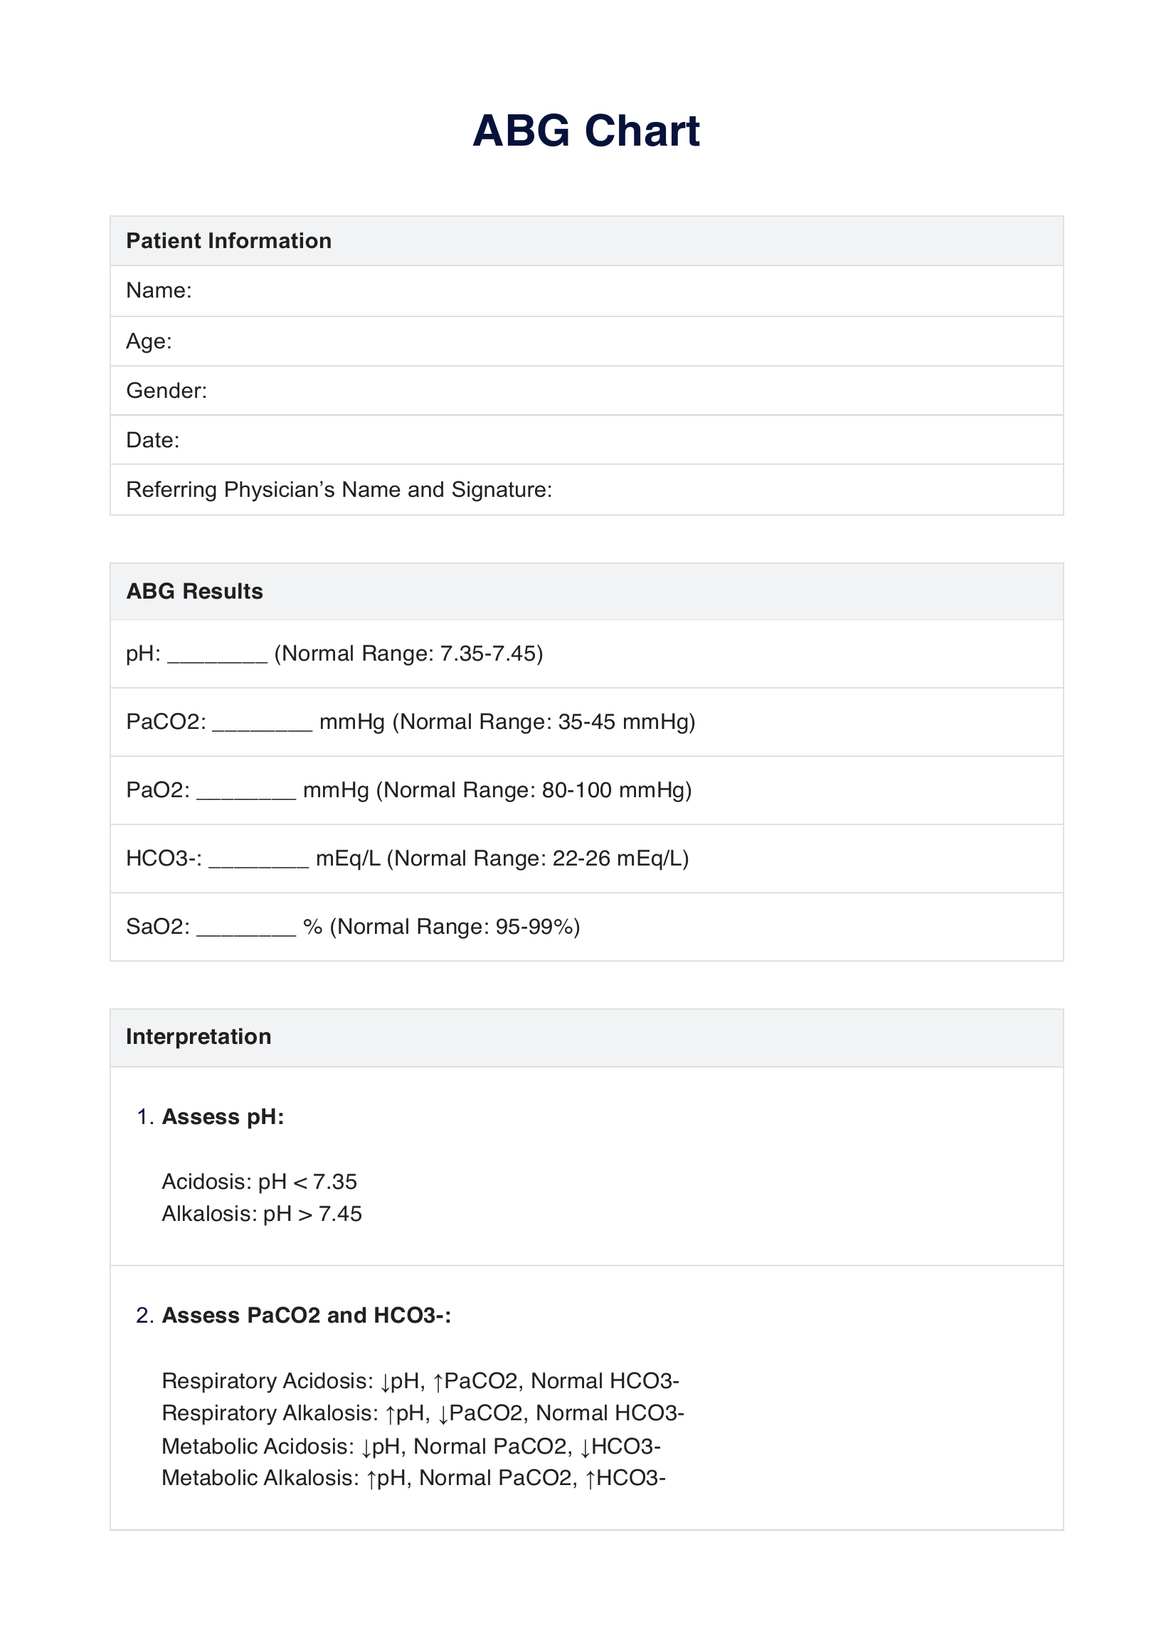
Usually, interpreting one's ABG results follows sequential steps like assessing the pH values, examining the PaCO2 and HCO3- levels, and any other compensatory mechanisms attempting to rectify the balance. The referring physician will determine if the pH, PaCO2, and HCO3 are under acidosis, alkalosis, or normal. Then, using the tic-tac-toe method, said physician can determine if the patient has acidosis or alkalosis, has metabolic or respiratory issues, or is compensating for any deficiencies in one's body.
On our ABG chart, you can expect to find established reference ranges for critical parameters like oxygen saturation (SaO2), bicarbonate (HCO3-), pH, partial pressure of oxygen (PaO2), and partial pressure of carbon dioxide (PaCO2). With these reference ranges, you can spot irregularities and pinpoint their causes. Aside from those, you can also find dedicated sections for patient information, ABG results, a summary of interpretations, and additional notes.


