What Is a BUN/Creatinine Ratio Chart?

A BUN/Creatinine Ratio Chart is a valuable resource in healthcare, providing a comprehensive overview of the Blood Urea Nitrogen (BUN) to Creatinine ratio in the blood. This chart visually represents the relationship between two critical blood markers, offering insights into kidney function and overall metabolic health.

BUN is a measure of the amount of urea nitrogen in the blood. Urea is a byproduct of protein metabolism in the liver and is excreted through the kidneys. Elevated levels may indicate issues with kidney function, dehydration, or certain medications.

Creatinine is a waste product produced by muscles and filtered out of the blood by the kidneys. The creatinine level in the blood is a crucial indicator of kidney function. Elevated creatinine levels may suggest impaired kidney function.

The BUN/Creatinine Ratio is a calculated value obtained by dividing the BUN level by the creatinine level. This ratio is crucial in assessing the potential causes of abnormal BUN or creatinine levels. An average BUN/Creatinine Ratio falls within a specific range, and deviations from this range can provide valuable diagnostic information.
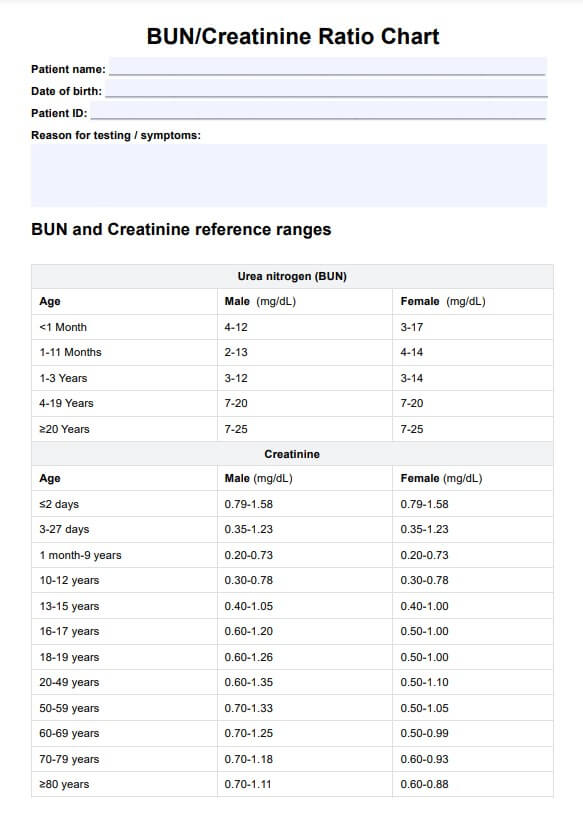
The chart visually represents the normal range for the BUN/Creatinine Ratio. Healthcare practitioners use this chart to interpret the results of blood tests and identify imbalances that may indicate kidney dysfunction, dehydration, or other underlying health issues. Abnormal ratios may prompt further investigation, such as additional tests or medical interventions, to address potential kidney problems.

Check out our free BUN/Creatinine Ratio Chart PDF

Download our BUN/Creatinine Ratio Chart here

How Does It Work?

Understanding and utilizing a ratio chart is straightforward, assisting healthcare professionals in evaluating kidney function and metabolic health. Here's a breakdown of the steps involved:

1. Access the Form

Obtain a printable BUN/Creatinine Ratio Chart. These charts are often available online or can be provided by healthcare facilities.

2. Identify Patient Information

Fill in essential patient details, including name, date of birth, and other required identifiers. Ensuring accurate patient information is crucial for proper record-keeping.

3. Conduct Blood Tests

Collect blood samples from the patient. Standard blood tests measure both BUN and creatinine levels. Ensure that the blood samples are properly labeled and handled to maintain accuracy.

4. Obtain BUN and Creatinine Values

Retrieve the BUN and creatinine values from the blood test results. These values are typically provided in units of mg/dL (milligrams per deciliter).

5. Calculate BUN/Creatinine Ratio

Use the formula: BUN/Creatinine Ratio = BUN level (mg/dL) / Creatinine level (mg/dL). Perform the calculation to obtain the ratio.

6. Refer to the Chart

Consult the BUN/Creatinine Ratio Chart. It will likely be presented as a visual guide with a range of expected values. Locate where the calculated ratio falls within this range.

7. Interpret Results

Analyze the position of the calculated ratio on the chart. A ratio within the normal range suggests healthy kidney function, while deviations may indicate potential issues that require further investigation.

8. Document and Share

Record the calculated ratio on the chart. This information can be included in patient records and shared with colleagues or specialists involved in the patient's care.

9. Take Necessary Actions

Based on the interpretation, healthcare professionals may recommend additional tests, interventions, or adjustments to the patient's treatment plan as needed.

BUN/Creatinine Ratio Chart Example (Sample)

The ratio chart is a comprehensive snapshot of John Doe's kidney function during a routine health check-up. The chart captures vital patient information, including demographics and specific blood test results, showcasing a BUN level of 15.2 mg/dL and a creatinine level of 1.0 mg/dL. 

The calculated ratio of 15.2 falls comfortably within the normal range of 10:1 to 20:1, indicating healthy kidney function. In this case, the clinical context revolves around a routine assessment, and the chart provides a clear interpretation of results, eliminating the need for immediate interventions. 

With additional notes highlighting the absence of significant clinical symptoms, the healthcare professional, Dr. A. Smith, MD, has scheduled the follow-up for continued monitoring on December 15, 2023. This personalized ratio chart is a tangible document that integrates clinical data, interpretation, and recommendations, ensuring a comprehensive approach to patient care.

A detailed chart example, including patient information and the healthcare professional's signature, can be accessed in the provided BUN/Creatinine Ratio Chart PDF for further reference and documentation.

Download our BUN/Creatinine Ratio Chart PDF here

BUN/Creatinine Ratio Chart Example

When Would You Use This Chart?

The BUN/Creatinine Ratio Chart is a valuable resource in various healthcare scenarios, aiding practitioners in assessing kidney function and metabolic health. Here are vital instances when this chart proves instrumental for relevant practitioners:

  • Routine Health Check-ups: Incorporate the chart in routine health screenings to assess kidney function as part of comprehensive check-ups.
  • Nephrology Assessments: This is essential for nephrologists when evaluating patients with known or suspected kidney disorders. The chart helps in diagnosing conditions such as acute or chronic kidney disease.
  • Preoperative Assessments: Include the BUN/Creatinine Ratio Chart in preoperative evaluations to ensure optimal kidney function before surgical procedures, helping to identify potential complications.
  • Monitoring Chronic Conditions: Use the chart for ongoing monitoring of patients with chronic conditions affecting the kidneys, such as diabetes or hypertension.
  • Dehydration Assessment: Implement the ratio chart to evaluate dehydration, as elevated BUN levels may indicate reduced fluid volume.
  • Medication Management: Useful for practitioners managing medications that can impact kidney function. Regular monitoring of the chart helps ensure medication safety.
  • Emergency Room Admissions: Incorporate the chart in emergency settings to quickly assess and triage patients with potential kidney issues, providing timely interventions.
  • Geriatric Care: Particularly relevant in senior care, where kidney function may be more vulnerable. The chart aids in assessing and managing kidney health in older adults.
  • Sports Medicine: The chart can be a valuable diagnostic tool for sports medicine practitioners, especially when dehydration might be a concern.
  • Pregnancy Monitoring: During prenatal care, the chart helps monitor kidney function in pregnant individuals, ensuring early detection of potential complications.
Clinical documentation software positive feedback

What Do the Results Mean?

Interpreting the results of a BUN/Creatinine Ratio Chart is crucial for understanding kidney function and metabolic health. Here's a breakdown of expected outcomes and their implications:

  • Normal Range: A ratio within the normal range typically suggests healthy kidney function. This range can vary slightly between laboratories, but it commonly falls between 10:1 and 20:1. In this scenario, the kidneys efficiently filter waste products, and metabolic processes function optimally.
  • Elevated BUN with Normal Creatinine: An elevated BUN level with an average creatinine level may indicate issues outside the kidneys, such as dehydration or gastrointestinal bleeding. Elevated BUN can result from increased protein breakdown or reduced fluid intake.
  • Elevated Creatinine with Normal BUN: Elevated creatinine with an average BUN level is often associated with impaired kidney function. This could signal acute or chronic kidney disease, where the kidneys struggle to filter and excrete waste efficiently.
  • Elevated BUN and Creatinine: Simultaneously elevated BUN and creatinine levels suggest significant kidney dysfunction. This could be indicative of severe dehydration, acute kidney injury, or chronic kidney disease. Immediate medical attention and further diagnostic tests are typically warranted.
  • Low BUN/Creatinine Ratio: A low ratio may result from malnutrition, liver disease, or certain medications. It requires careful assessment to determine the underlying cause and appropriate management.
  • High BUN/Creatinine Ratio: Conversely, an elevated ratio may signal dehydration, a diet high in protein, or conditions affecting the absorption of nutrients in the digestive system.
  • Pregnancy Considerations: BUN/Creatinine Ratio values may differ slightly in pregnancy. Healthcare providers consider these variations within the context of the individual's health and the specific pregnancy-related challenges.
  • Geriatric Considerations: A mild increase in BUN and creatinine is expected in older adults due to age-related changes in kidney function. However, significant deviations may still warrant investigation.

Why Use Carepatron as Your BUN/Creatinine Ratio App?

Unlock the full potential of your healthcare practice with Carepatron, the premier destination for streamlined and efficient work in managing ratio charts

Our dedicated app and software offer a sophisticated yet user-friendly solution tailored to the unique needs of modern healthcare practitioners.

Our commitment to radical accessibility and customization is reflected in our healthcare tools and resources, like the BUN/Creatinine Ratio Chart app. It breaks down barriers and seamlessly integrates into your practice. Our customizable solutions enhance efficiency and effectiveness, empowering you to work in a way that fits your workflow.

Step into the future of healthcare with our evolving software. Experience a user-friendly interface and innovative features that provide authoritative information without complexity. Excel in your work with technology that keeps you at the forefront of healthcare.

Our ratio app is a reliable resource for managing charts backed by research and evidence. Our positive and personable approach makes every interaction informative and inspiring. 

Join our community of modern healthcare practitioners and revolutionize your practice with Carepatron. Choose us for a seamless blend of accessibility, customization, and cutting-edge technology for an intelligent and inspired healthcare practice.

Clinical documentation software benefit

References

Allarakha, S., MD, & Surgeon, R. R. E. H. a. N. (2022, March 4). What level of BUN indicates kidney failure? Stages. MedicineNet. https://www.medicinenet.com/what_level_of_bun_indicates_kidney_failure/article.htm 

Davis, C. P., MD Ph.D. (2022, March 18). Creatinine blood test: Normal, low, high levels, causes & symptoms. MedicineNet. https://www.medicinenet.com/creatinine_blood_test/article.htm 

Lu, C. M., MD PhD. (2022, December 21). Urine protein and urine protein to creatinine ratio test - Testing.com. Testing.com. https://www.testing.com/tests/urine-protein-and-urine-protein-creatinine-ratio/ 

Manoeuvrier, G., Bach-Ngohou, K., Batard, É., Masson, D., & Trewick, D. (2017). Diagnostic performance of serum blood urea nitrogen to creatinine ratio for distinguishing prerenal from intrinsic acute kidney injury in the emergency department. BMC Nephrology, 18(1). https://doi.org/10.1186/s12882-017-0591-9 

Peng, R., Liu, K., Li, W., Yuan, Y., Niu, R., Zhou, L., Xiao, Y., Gao, H., Yang, H., Zhang, C., Zhang, X., He, M., & Wu, T. (2021). Blood urea nitrogen, blood urea nitrogen to creatinine ratio and incident stroke: The Dongfeng-Tongji cohort. Atherosclerosis, 333, 1–8. https://doi.org/10.1016/j.atherosclerosis.2021.08.011 

Rachoin, J., Daher, R., Moussallem, C., Milcarek, B., Hunter, K., Schorr, C., Abboud, M., Henry, P., & Weisberg, L. S. (2011). The fallacy of the BUN: creatinine ratio in critically ill patients. Nephrology Dialysis Transplantation, 27(6), 2248–2254. https://doi.org/10.1093/ndt/gfr705 

Shen, S., Yan, X., & Xu, B. (2022). The blood urea nitrogen/creatinine (BUN/cre) ratio was U-shaped and associated with all-cause mortality in the general population. Renal Failure, 44(1), 184–190. https://doi.org/10.1080/0886022x.2022.2030359 

Tariq, M., Memon, M., Jafferani, A., Shoukat, S., Gowani, S. A., Nusrat, R., Riaz, M., Patel, J., Jamil, B., & Smego, R. A. (2009). Massive Fluid Requirements and an Unusual BUN/Creatinine Ratio for Pre-Renal Failure in Patients with Cholera. PLOS ONE, 4(10), e7552. https://doi.org/10.1371/journal.pone.0007552

Who typically requests a BUN/Creatinine Ratio Chart?

Commonly asked questions

Who typically requests a BUN/Creatinine Ratio Chart?

Healthcare professionals, including nephrologists, general practitioners, and specialists, often request charts to assess kidney function and metabolic health.

When are BUN/Creatinine Ratio Charts used?

BUN/Creatinine Ratio Charts are used in various scenarios, including routine health check-ups, nephrology assessments, preoperative evaluations, and ongoing monitoring of chronic kidney conditions.

How are BUN/Creatinine Ratio Charts used?

The process involves obtaining blood samples, measuring BUN and creatinine levels, calculating the ratio, and consulting the chart to interpret results. It aids in diagnosing kidney disorders and guiding treatment decisions.

How long does a BUN/Creatinine Ratio Chart take?

The time required for a ratio chart depends on factors such as the availability of blood test results and data input efficiency. Generally, the process is swift, allowing for timely assessment and intervention in patient care.

Join 10,000+ teams using Carepatron to be more productive

One app for all your healthcare work