Ferritin Level
Monitor iron status effectively with our Ferritin Level Chart—a valuable tool for healthcare professionals.
What Is a Ferritin Level Chart?
A ferritin level chart is a graphical representation or reference guide that displays the normal range of ferritin levels in the human body. Ferritin is a protein found in cells that stores iron and releases it when the body needs it. Monitoring ferritin levels is crucial because they provide valuable information about a person's iron storage and overall iron status.
The chart typically displays ferritin levels in units of nanograms per milliliter (ng/mL) or micrograms per liter (μg/L) and arranges them on a scale. Ferritin-level charts are commonly used in clinical settings, such as hospitals and laboratories. They are essential for healthcare professionals, especially when diagnosing and managing conditions related to iron deficiency or iron overload.
Healthcare providers rely on ferritin level charts to make informed decisions regarding iron supplementation, dietary recommendations, and the diagnosis and treatment of various iron-related disorders. Understanding the chart's context and the patient's unique circumstances is crucial for accurate assessment and appropriate management of their iron status.
Manage health levels with our Ferritin Level Chart
Download our Ferritin Level Chart PDF here
How Does It Work?
1. Obtain the Chart
Start by obtaining a printable ferritin level chart. You can often find these charts on medical websites, healthcare provider offices, or medical textbooks. Ensure that the chart is up-to-date and includes the reference values relevant to your region.
2. Understand the Units
Check whether the chart is in nanograms per milliliter (ng/mL) or micrograms per liter (μg/L). Make sure you understand the units used in the chart to avoid misinterpretation.
3. Collect Test Results
If you have recent ferritin level test results, gather this information. Ferritin levels are typically measured through a blood test, so have your laboratory report ready.
4. Identify Your Level
Locate the reference range on the chart, usually marked by a shaded area or specific values. It typically ranges from 20 to 300 ng/mL. Find the value closest to your ferritin level within this range.
5. Interpret Your Status
Determine whether your ferritin level falls within the normal range. If it does, your iron storage is considered adequate. If it's below the normal range, you may be iron deficient. If it's above, there could be an iron overload concern.
6. Consider Clinical Context
Keep in mind that interpreting ferritin levels should consider the patient's circumstances. Symptoms, medical history, and other blood tests like hemoglobin levels are essential factors to assess the iron status accurately.
7. Seek Medical Advice
If your ferritin levels are outside the normal range or if you have concerns about your iron status, it is essential to consult a healthcare professional. They can provide a comprehensive evaluation and recommend appropriate treatment or dietary changes.
A ferritin level chart can provide insights into your iron status, but it’s only a tool for initial assessment. A healthcare provider's expertise is necessary for the proper evaluation and management of iron-related issues.
Ferritin Level Chart Example (Sample)
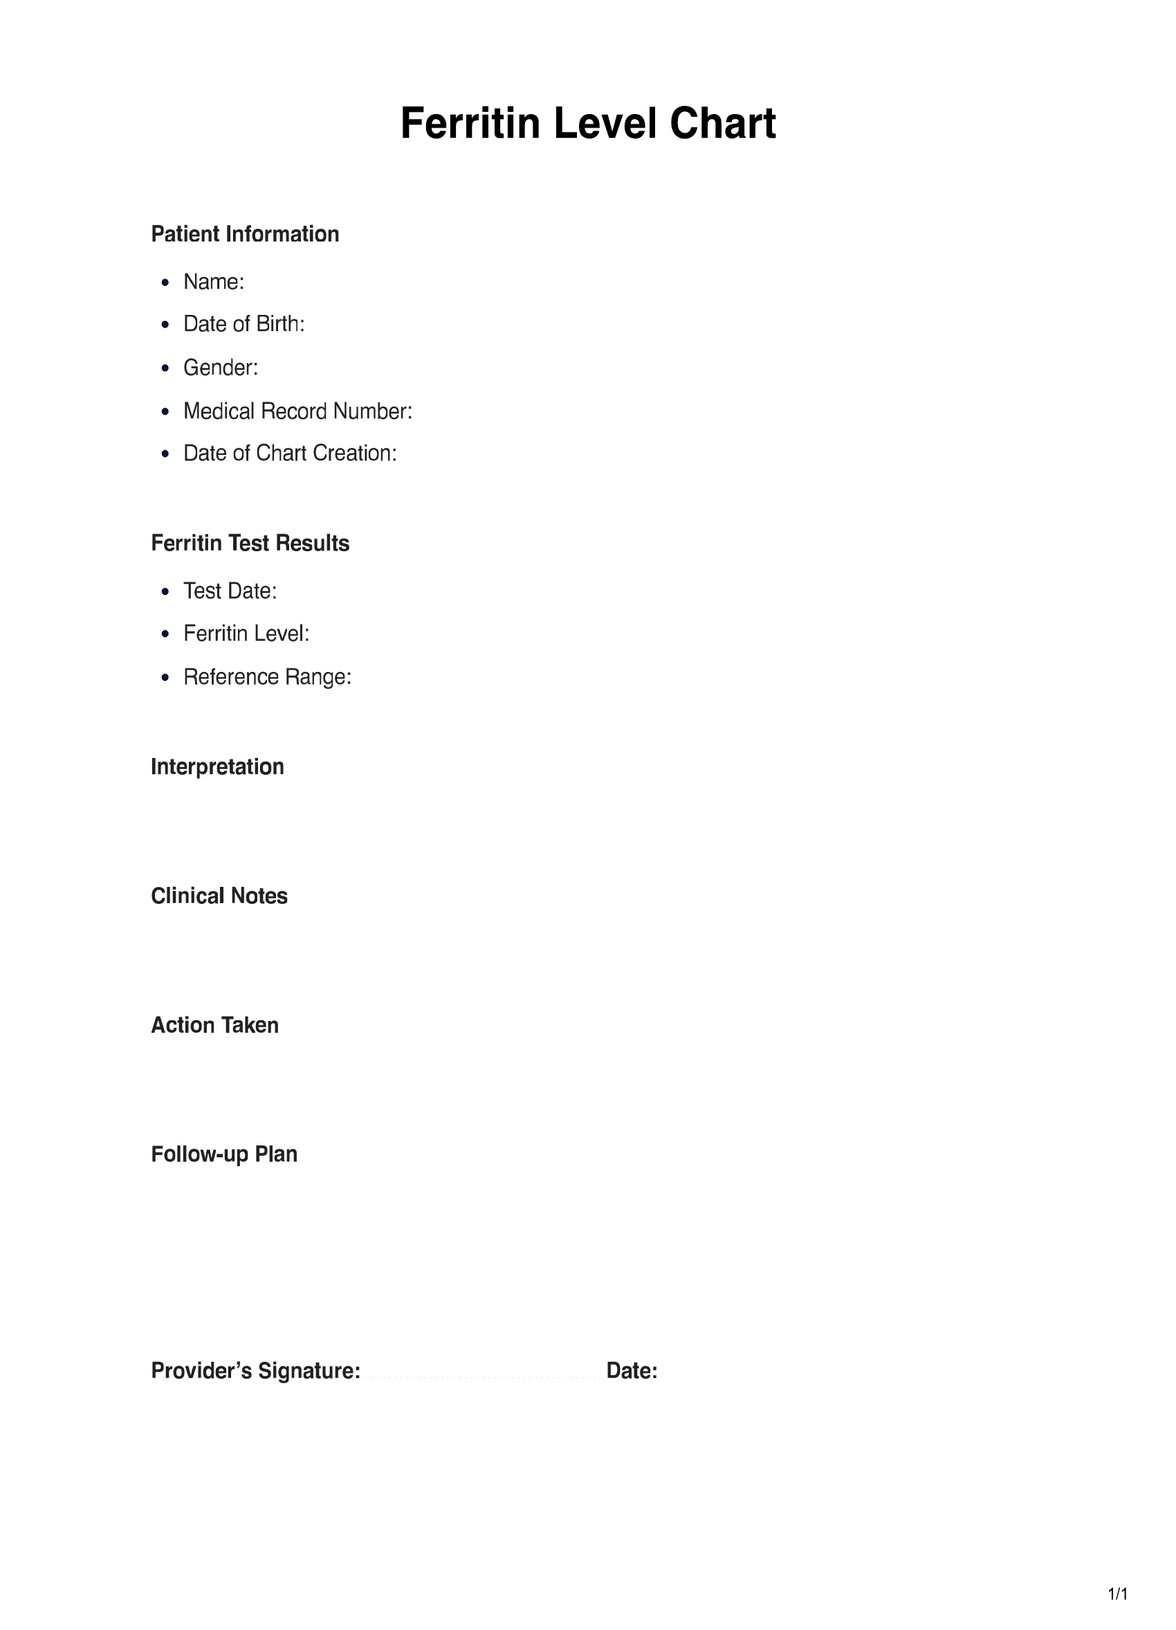
This ferritin-level chart example offers a practical and comprehensive template for healthcare professionals to monitor and manage patients' iron status effectively. The chart includes essential patient information, ferritin test results, interpretation of the levels, clinical notes, actions taken, and a follow-up plan. It ensures precise documentation and tracking of ferritin levels in a standardized manner.
This Ferritin Level Chart PDF is a valuable tool for healthcare facilities and providers, allowing them to easily record, interpret, and address ferritin-level findings. Whether diagnosing iron deficiency, iron overload, or other related conditions, this chart facilitates organized data management and promotes quality patient care by aiding in timely interventions and follow-up.
Download our Ferritin Level Chart PDF here

When Would You Use This Chart?
A ferritin level chart is a valuable resource primarily used by healthcare professionals in clinical settings and individuals who want to monitor their iron status. Here are situations and contexts where you might use a ferritin-level chart:
- Iron Deficiency Diagnosis: Medical practitioners use ferritin level charts to diagnose iron deficiency, a condition characterized by low ferritin levels. This is crucial in anemia, unexplained fatigue, and other iron deficiency-related symptoms.
- Anemia Management: Hematologists and primary care physicians rely on ferritin levels to guide treatment for anemia. When hemoglobin levels are low, a low ferritin level supports the diagnosis of iron-deficiency anemia.
- Iron Overload Assessment: For individuals with hereditary hemochromatosis or thalassemia, ferritin level charts help monitor iron overload. High ferritin levels indicate the potential for iron accumulation in organs.
- Dietary Guidance: Nutritionists and dietitians may use ferritin level charts to provide dietary recommendations for individuals with iron-deficiency anemia. By understanding ferritin levels, they can tailor iron-rich food suggestions.
- Pre-operative Evaluation: Surgeons and anesthesiologists may assess ferritin levels before surgery to determine a patient's ability to tolerate blood loss during the procedure. Low ferritin levels could indicate an increased risk of post-operative anemia.
- Athletic Performance Optimization: Sports physicians and coaches might use ferritin level charts to monitor the iron status of athletes. Low ferritin can impact performance, so ensuring adequate iron stores is vital for sports performance.
- Chronic Disease Management: Physicians managing patients with chronic inflammatory diseases, such as rheumatoid arthritis, use ferritin levels to monitor the impact of these conditions on iron storage and assess the need for iron supplementation.
- Routine Health Checkups: Some individuals, especially those at risk of iron-related issues, might request ferritin-level tests for routine health checkups. They can use ferritin-level charts to understand their results better.

What Do the Results Mean?
Interpreting ferritin level results is essential for understanding an individual's iron status. A free ferritin level chart can help in comprehending these results, and here's what common ferritin level outcomes typically mean:
- Iron Deficiency: Ferritin levels below the normal range (usually under 20 ng/mL) are a strong indicator of iron deficiency. This may lead to anemia, causing fatigue, weakness, and pale skin. Dietary changes or iron supplementation may be recommended.
- Adequate Iron Storage: Ferritin levels falling within the standard range (typically 20 to 300 ng/mL) suggest that iron stores are sufficient to meet the body's needs. This is a desirable result, indicating a reduced risk of anemia.
- Iron Overload: Elevated ferritin levels above the normal range can indicate iron overload or hemochromatosis. High ferritin may also be related to chronic inflammatory conditions, liver disease, or excessive iron supplementation.
It's crucial to interpret ferritin results regarding the individual's overall health. A person with normal ferritin levels who is experiencing symptoms of anemia may have another underlying condition. Conversely, someone with slightly low ferritin levels who is asymptomatic may not require immediate intervention.
It's important to consider gender and age differences when interpreting ferritin levels. Adult men tend to have higher ferritin levels than women, and children may have different reference ranges.
Research & Evidence
The concept of ferritin, an intracellular protein that stores iron, was first discovered in the 1930s. It was initially seen as a marker for iron storage within cells, especially in the liver and spleen.
As the understanding of iron metabolism and its clinical significance grew, ferritin levels were recognized as a valuable indicator of an individual's iron status. Researchers and clinicians sought to establish reference ranges for ferritin to aid in diagnosing and managing iron-related disorders.
A considerable body of research has explored the role of ferritin in health and disease. Studies have shown the correlation between low ferritin levels and iron deficiency anemia, emphasizing the importance of ferritin in the assessment of iron status.
Research has also discovered the relationship between elevated ferritin levels and conditions like hemochromatosis, a hereditary iron overload disorder. This evidence has informed clinical guidelines for diagnosing and managing such conditions.
Ferritin-level charts are now widely used in clinical practice, thanks to the wealth of evidence supporting their utility. They aid in diagnosing and managing iron-related disorders, guiding treatment decisions, and monitoring patients' progress.
Ongoing research continues to refine our understanding of ferritin's role in health and disease. New technologies and methodologies have enhanced the accuracy of ferritin measurement and its interpretation, leading to more precise diagnosis and treatment.
Commonly asked questions
Ferritin Level Charts are typically requested by healthcare professionals such as doctors, nurses, and dietitians, as well as individuals who want to monitor their iron status.
Ferritin Level Charts are used when assessing an individual's iron status, diagnosing conditions like iron deficiency or iron overload, guiding anemia treatment, optimizing athletic performance, and monitoring chronic diseases that affect iron levels.
Ferritin Level Charts are used to interpret ferritin blood test results, typically measured in nanograms per milliliter (ng/mL) or micrograms per liter (μg/L). They help determine if ferritin levels are within the normal range, low (indicating iron deficiency) or high (indicating iron overload).
Using a Ferritin Level Chart is a quick process, typically taking just a few minutes to interpret ferritin test results and assess an individual's iron status. The time required may vary depending on the situation's complexity and the need for further medical evaluation.
Why Use Carepatron as Your Ferritin Level App?
Discover why Carepatron's Ferritin Level Chart app is your go-to choice for managing your iron status. Our state-of-the-art Ferritin Level Chart Software is designed with your health in mind, ensuring accuracy, convenience, and seamless integration into your healthcare routine.
Our Ferritin Level Chart app provides a precise tool for monitoring your iron levels. Whether you're a healthcare professional or an individual tracking your health, our software provides accurate and easy-to-understand ferritin-level charts. With a user-friendly interface, you can input and interpret your results effortlessly, aiding in better decision-making for your well-being.
We offer more than just a Ferritin Level Chart app; it's a holistic healthcare management platform. Seamlessly integrate your ferritin level data with other health information, creating a comprehensive view of your well-being. Monitor trends, set test reminders, and collaborate with healthcare providers – all within one platform. Your health journey deserves this level of support and convenience.
Your health data is precious, and Carepatron values your privacy and security. Our Ferritin Level Chart Software adheres to the highest data protection standards, ensuring the confidentiality of your health information. Trust us to safeguard your sensitive data as you manage your iron status.
Don't compromise on your health management. Choose Carepatron's Ferritin Level Chart app and experience the precision, convenience, and comprehensive health management you deserve. Your journey to optimal health starts here.

References
Famia, B. P. D. M. M. F. (n.d.). Iron: reference range, interpretation, collection, and panels. https://emedicine.medscape.com/article/2085704-overview?form=fpf
Gerber, G. F. (2023, October 16). Iron deficiency anemia. MSD Manual Professional Edition. https://www.msdmanuals.com/professional/hematology-and-oncology/anemias-caused-by-deficient-erythropoiesis/iron-deficiency-anemia
HealthMatters.io LLC. (n.d.). Ferritin (female range) | Healthmatters.io. https://healthmatters.io/understand-blood-test-results/ferritin-female-range
LearnHaem. (2020, February 29). Interpreting Iron Studies - LearnHaem | Haematology Made Simple. LearnHaem | Haematology Made Simple. https://www.learnhaem.com/courses/anaemia/lessons/iron-deficiency/topic/interpreting-iron-studies/
Mims. (n.d.). Anemia - Iron-Deficiency Diagnosis | MIMS Singapore. https://specialty.mims.com/anemia%20-%20iron-deficiency/diagnosis
Ministry of Health. (2023a, September 14). Iron Deficiency – Diagnosis and Management - Province of British Columbia. https://www2.gov.bc.ca/gov/content/health/practitioner-professional-resources/bc-guidelines/iron-deficiency
Ministry of Health. (2023b, September 17). High ferritin and iron overload – Investigation and Management - Province of British Columbia. https://www2.gov.bc.ca/gov/content/health/practitioner-professional-resources/bc-guidelines/iron-overload
Oh, H. L., Lee, J. A., Kim, D. H., & Lim, J. S. (2018). Reference values for serum ferritin and transferrin saturation percentage in Korean children and adolescents. Blood Research, 53(1), 18. https://doi.org/10.5045/br.2018.53.1.18
Salko, E. (2023, August 15). Ferritin blood test: What high level of ferritin is concerning? Personalabs. https://www.personalabs.com/blog/ferritin-blood-test-what-high-level-of-ferritin-is-concerning/
The Royal Australian College of general Practitioners. (n.d.). Elevated serum ferritin. Australian Family Physician. https://www.racgp.org.au/afp/2012/december/elevated-serum-ferritin