What is an Iron Levels Chart?

An iron levels chart, in the context of medical diagnostics, refers to a graphical representation or tabular format that shows the results of various tests used to quantify or measure the concentration of iron in an individual’s body. The existence of this chart is due to the importance of iron in maintaining one’s overall health and the need to identify iron-related conditions for immediate intervention because of its significant health implications. 

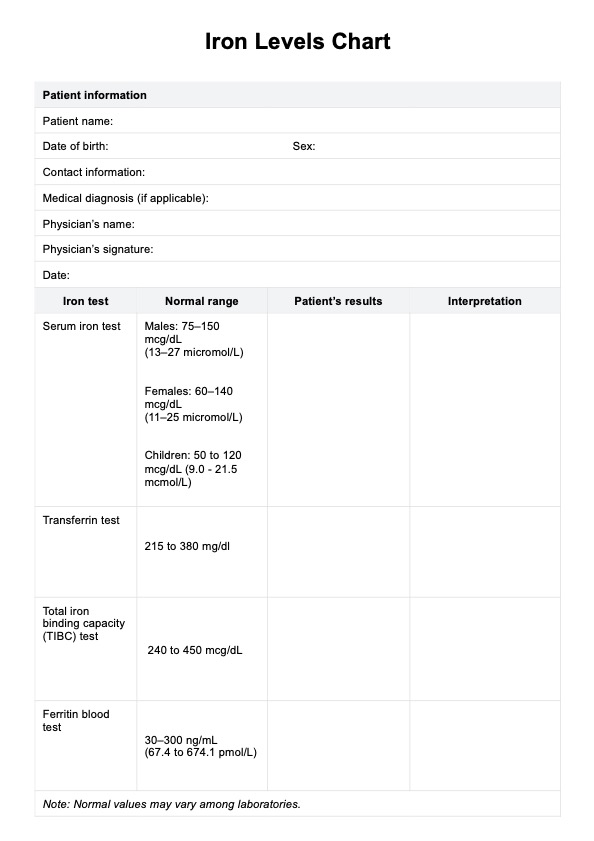
The chart typically includes results from the tests that measure iron, such as the serum iron test, transferrin test, total iron-binding capacity (TIBC) test, and ferritin blood test. These tests provide insights into the different aspects of iron metabolism in the body, such as the amount of iron in one’s blood, the capacity and amount of transferring to bind with iron, and the level of iron storage in the body.

The chart’s purpose is to present an overview of an individual’s iron status, Having all of these on a single document can help healthcare practitioners to more easily diagnose conditions like anemia or hemochromatosis and devise treatment/management strategies. 

Our take on the iron levels chart includes a table where you have space to write down your patient’s result and their corresponding interpretation based on the provided expected normal range.

Printable Iron Levels Chart PDF

Check out our free Iron Levels Chart

How does it work?

Step One. Acquire the Template

Ensure you have access to a valuable resource, such as the iron levels chart, for your convenience. You can do this by selecting either the “Download Template” or “Use Template” button. Alternatively, you can find the chart in Carepatron’s template library on the app or website by searching for “Iron Levels Chart.”

Step Two. Input Essential Information

If you intend to extend the chart’s utility beyond serving as a visual aid or patient education, it is recommended to include essential patient details, including the results for the four iron tests: serum iron, TIBC, transferring, and ferritin. 

Step Three. Compare and Differentiate

Next, utilize the provided chart to compare and differentiate between the normal levels on the chart and those identified in your patient’s test results document. Ensure to consider factors like age, gender, and the patient’s current condition during your analysis. 

Step Four. Record Your Analysis

On our template, you can record your observations and findings in the designated space for interpreting results. Additionally, if you want, you may use the space at the bottom for writing the summary of results and any supplementary information like further examinations or medical interventions. 

Step Five. Safeguard the Template

Upon completing your consultation, it is essential to securely store the template, restricting access to relevant individuals exclusively. For digital copies, we recommend storing your document on Carepatron, a HIPAA-compliant, free patient records software capable of safeguarding all medical records, including a completed chart of iron levels relevant to your patient.

Iron Levels Chart Example (sample)

We prepared a PDF file that contains a completed iron levels chart template, which is both printable and accessible in a digital format. Feel free to review, print, or save a copy whenever you need guidance on using the template for assessing and interpreting your patient’s results. However, please note that the information presented in this example is entirely fictional. 

Furthermore, how the chart is used represents just one of the many possible approaches to maximize the template’s usefulness. We recommend customizing it to suit your specific requirements, aligning it with the results you’ve obtained from the iron tests. 

You can access and download either by viewing the sample below or by clicking the “Download Example PDF” button.

Download our free Iron Levels Chart PDF

Iron Levels Chart Example (sample)

When would you use this Chart?

Iron level charts are commonly used in various clinical scenarios to assess and monitor an individual’s iron status. Here’s a list of the situations in which an iron level chart is typically utilized: 

Identifying Iron-Related Problems or Conditions

Since iron tests are typically requested when a person exhibits symptoms of an iron-related problem or condition such as anemia, deficiency, or overload, the chart can be used as a reference when coming up with a diagnosis or identifying the underlying reason for the iron test results. Aside from that, you can also use the chart as a document to record the results for future use. 

Monitoring Treatment

If you create multiple copies of the iron levels chart, you can use the iron levels chart to track the effectiveness of treatments that are aimed to either elevate or reduce iron levels within the body. One example is using the chart to periodically monitor the levels of individuals taking iron supplements or undergoing therapies to manage iron overload. 

Differential Diagnosis

The chart can also be used to help rule out other conditions that manifest similar symptoms to iron deficiency anemia or iron overload. Such conditions are aplastic anemia, anemia or inflammation, or anemia due to vitamin deficiencies.

EHR software positive feedback

What do the results mean?

Interpreting the results and writing them down on your free iron level chart template provides essential information about an individual’s iron status needed to diagnose and address potential health concerns. To help you out, here’s a general interpretation of what these results mean. 

Serum Iron Test

This is the test that measures the iron concentration in one’s bloodstream. If the patient has low serum iron levels, it often indicates an iron deficiency that results from inadequate dietary iron intake, malabsorption issues, or blood loss. On the other hand, elevated serum iron levels may signal excessive iron consumption, intake of certain vitamins, or conditions like hemolytic anemia, liver failure, or hepatitis. 

Transferrin Test

This is the test that checks the quantity of transferrin, which is a vital iron-transporting protein. Low levels may stem from insufficient transferrin production by the liver or excessive renal loss. While elevated transferring levels can suggest iron-deficiency anemia. 

Total Iron-Binding Capacity (TIBC) Test

This test evaluates how effectively iron binds to transferring and other blood proteins. An elevated TIBC value, typically above 450 mcg/dL, often indicates low blood iron levels, potentially due to increased menstrual blood loss, dietary deficiencies, pregnancy, or chronic infections. 

Ferritin Blood Test

A ferritin test checks how much iron is stored in the body. A low ferritin level in the blood signifies depleted iron stores indicating iron deficiency. Conversely, elevated ferritin levels may point to a condition causing excess iron storage.

Why use Carepatron as your Iron Levels app?

Selecting Carepatron as your preferred app for interpreting results with the help of an iron level chart and conducting an iron panel test offers numerous advantages for healthcare professionals like yourself. 

Carepatron provides a centralized workspace, allowing you to organize documents and electronic patient records efficiently, set patient appointment reminders, and handle medical billing within the platform itself, eliminating the need to download additional software, This integrated approach streamlines processes and tasks related to iron level charting and other medical activities, enabling you to dedicate more of your time, focus, and energy to patient care. 

Moreover, Carepatron is committed to enhancing your efficiency and productivity in your practice. You can customize tools and workflows to suit your specific needs and empower practitioners and patients to manage administrative tasks such as service booking and filling out relevant paperwork. This improves the overall experience for individuals using the app, whether they are in the healthcare facility or elsewhere. 

Accessibility is one of the priorities for Carepatron. That’s why the app is accessible on various devices, ensuring that you have portable medical dictation software at your disposal, making it convenient to create clinical notes when necessary, even when your hands are occupied. Rest assured that all notes, as well as other patient and practitioner data, are safeguarded due to Carepatron’s compliance with global security standards, including HIPAA, GDPR, and HITRUST. 

If you’re still uncertain, they say that trying it out for yourself is the best way to evaluate the benefits of using Carepatron. So, take advantage of Carepatron and sign up for an account today!

EHR software benefit

References

Fletcher, J. (2018, June 9). Serum iron test: High, low, and normal ranges. https://www.medicalnewstoday.com/articles/322083#interpreting-the-results

Louisebalmforth. (2023, August 23). What is the difference between ferritin and iron? - Forth With Life. Forth. https://www.forthwithlife.co.uk/blog/whats-the-difference-between-ferritin-and-iron/

Ning, S., & Zeller, M. P. (2019). Management of iron deficiency. Hematology, 2019(1), 315–322. https://doi.org/10.1182/hematology.2019000034

Who typically requests an Iron Levels Chart?

Commonly asked questions

Who typically requests an Iron Levels Chart?

Primary care doctors, hematologists, gastroenterologists, and cardiologists will likely request an iron levels chart.

When are iron level charts used?

The iron level charts are used when the referring physician has to analyze,  interpret, and monitor the patient’s iron levels.

How are Iron Levels Charts used?

The iron level charts are mainly used as a document where the referring physician can write down their observations and findings based on the analysis and interpretations they made.

Join 10,000+ teams using Carepatron to be more productive

One app for all your healthcare work