What is a CMP Normal Values Chart?

A Comprehensive Metabolic Panel (CMP) Normal Values Chart is an essential diagnostic resource in modern healthcare. It provides a set of standard reference ranges for key biochemical markers that are critical in evaluating a patient's metabolic and organ function.
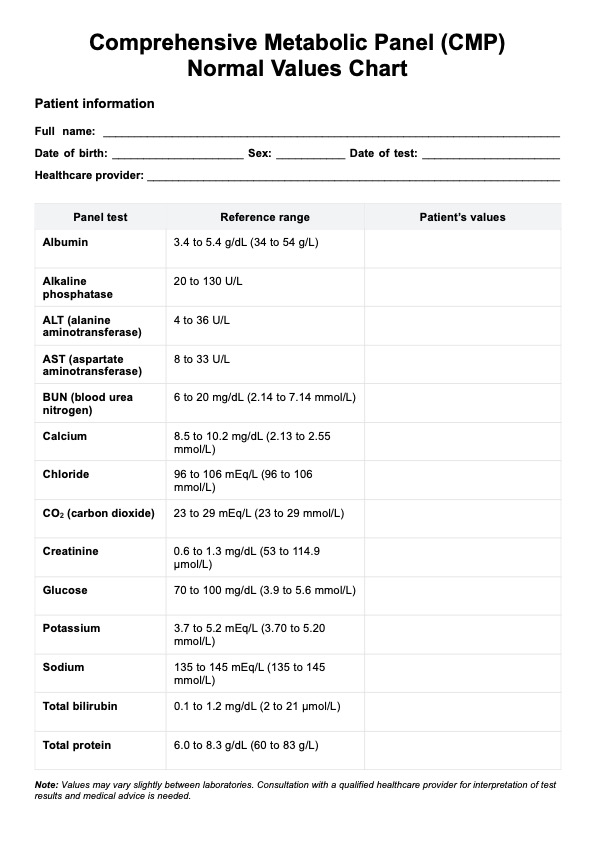
 Compared to a basic metabolic panel normal values chart, the CMP chart includes values for more tests.

This chart typically includes normal ranges for various parameters such as glucose levels, electrolytes (like sodium, potassium, chloride, and bicarbonate), kidney function tests (such as blood urea nitrogen [BUN] and creatinine), and liver enzymes (including ALT, AST, ALP, and bilirubin).

The primary purpose of the CMP Normal Values Chart is to aid healthcare professionals in interpreting the results of a CMP test. By comparing a patient's lab results with these standard values, physicians can identify any abnormalities that may indicate various health issues, from metabolic disorders and kidney dysfunction to liver disease and diabetes. For instance, elevated glucose levels might suggest diabetes, while abnormal liver enzyme levels could point to liver damage or disease.

Moreover, the CMP Normal Values Chart is a tool for diagnosing and maintaining chronic conditions. It helps track treatment plan progress and adjust medications as needed. The CMP Normal Values Chart is a quick reference guide in clinical practice that supports decision-making. It's particularly valuable in emergency settings where rapid diagnosis is crucial. The availability of a printable version of this chart enhances its utility, allowing for easy access and reference during patient consultations or team discussions.

The CMP Normal Values Chart is a cornerstone in patient care, enabling precise and timely diagnosis, effective monitoring, and informed management of various health conditions. Its role in guiding clinical decisions underscores the importance of accurate and standardized laboratory measurements in healthcare.

Download our free CMP Normal Values Chart PDF

Access our CMP Normal Values Chart here for better and more accurate health outcomes

How does it work?

The process of using a Comprehensive Metabolic Panel (CMP) Normal Values Chart in clinical practice involves several key steps:

Step 1: Collecting blood sample

This is typically done by drawing blood from a vein in the patient's arm. A healthcare professional, such as a nurse or phlebotomist, performs the process, ensuring the sample is collected safely and correctly.

Step 2: Laboratory analysis

Once the blood sample is collected and sent to a laboratory for detailed analysis, the laboratory uses various techniques to measure the levels of specific substances in the blood. These substances include glucose, electrolytes, kidney function markers, and liver enzymes. The accuracy of this analysis is crucial for reliable diagnosis and treatment.

Step 3: Comparing with normal values

After the laboratory analysis is complete, the results are compared against the standard ranges provided in the CMP Normal Values Chart. This chart is a benchmark to determine whether the patient's levels fall within normal limits or indicate potential health issues.

Step 4: Interpretation by healthcare professionals

Finally, healthcare professionals consider the patient's overall health, medical history, and current symptoms to understand the implications of deviations from normal values. This interpretation is critical in diagnosing conditions, monitoring disease progression, or assessing treatments' effectiveness.

Our Printable CMP Normal Values Chart is a fundamental tool in this process, providing a clear and standardized reference for healthcare providers. It aids in making informed patient care decisions, whether initiating further diagnostic tests, adjusting treatment plans, or providing specific medical advice.

CMP Normal Values Chart example (sample)

A typical CMP Normal Values Chart PDF includes reference ranges for components like albumin, blood urea nitrogen (BUN), calcium, carbon dioxide, chloride, creatinine, glucose, potassium, sodium, and liver enzymes (ALT, AST, ALP, bilirubin blood test). These ranges are established based on standardized laboratory methods and population averages.

Download our free CMP Normal Values Chart PDF

CMP Normal Values Chart Example

When would you use this chart?

The Comprehensive Metabolic Panel (CMP) Normal Values Chart is essential in various medical contexts, serving multiple purposes across healthcare settings. Its usage spans a wide range of clinical scenarios:

  • Routine health check-ups: One of the most common uses of the CMP Normal Values Chart is during routine health examinations. It helps assess an individual's overall health status, providing insights into vital organ functions.
  • Pre-surgical assessments: Before undergoing any surgical procedure, it's crucial to evaluate a patient's metabolic status to ensure they are fit for surgery. The CMP chart plays a significant role in this pre-operative evaluation.
  • Monitoring chronic conditions: For patients with chronic conditions like diabetes, hypertension, or kidney diseases, regular monitoring using the CMP chart is vital. It assists in tracking the progression of the disease and the effectiveness of ongoing treatments.
  • Evaluating symptoms: When patients present symptoms like fatigue, nausea, weight loss, or abdominal pain, the CMP chart can help pinpoint the underlying cause. It aids in differentiating between various potential diagnoses.
  • Emergency situations: In acute medical situations, such as suspected poisoning or overdose, the CMP chart provides rapid information about the patient's metabolic state, guiding immediate treatment decisions.
  • Research and education: Beyond clinical practice, the CMP Normal Values Chart is also used in medical research and education, helping students and researchers understand normal and abnormal metabolic functions.

Healthcare professionals, including general practitioners, internists, endocrinologists, nephrologists, and laboratory technicians, rely on the CMP Normal Values Chart for accurate diagnosis and effective treatment planning. 

Its role is pivotal in ensuring patients receive timely and appropriate medical care based on their metabolic health status. The chart's comprehensive nature makes it a cornerstone in the diagnostic process, underlining its significance in modern healthcare.

EHR software positive feedback

What do the results mean?

Interpreting the results of our Free Comprehensive Metabolic Panel (CMP) Normal Values Chart requires a nuanced understanding of what deviations from the norm might indicate. Each component of the CMP provides specific insights into various aspects of a patient's health:

  • Glucose levels: Elevated glucose levels are often a red flag for diabetes or prediabetes. However, they can also be influenced by factors like diet, stress, or certain medications.
  • Electrolyte balance: Abnormalities in electrolytes such as sodium, potassium, calcium, and chloride can indicate dehydration, kidney problems, or hormonal imbalances. For example, low potassium levels might suggest conditions like hypokalemia.
  • Kidney function tests: Elevated blood urea nitrogen (BUN) levels and creatinine can signal impaired kidney function. These markers are crucial for diagnosing and monitoring kidney diseases.
  • Liver enzymes: High levels of liver enzymes, such as ALT and AST, can indicate liver damage or inflammation. This could be due to various reasons, including hepatitis, alcohol use, or medication toxicity.
  • Protein levels: Abnormal total protein or albumin levels can point to liver or kidney disorders and nutritional issues.
  • Calcium levels: Calcium imbalances can be linked to bone disorders, kidney disease, or hormonal fluctuations.

It's crucial to interpret these results in the context of the patient's overall health, medical history, and other diagnostic tests. For instance, a single abnormal value may not be significant if the patient is otherwise healthy, but it could be critical in specific symptoms or chronic conditions.

Healthcare professionals use these results to guide further diagnostic testing, monitor the progression of known conditions, and adjust treatment plans accordingly. The CMP Normal Values Chart is a starting point, providing a snapshot of a patient's metabolic health. Still, the clinical expertise unravels the full story behind these numbers.

Why use Carepatron as your CMP Normal Values app?

Carepatron stands out as the premier choice for managing CMP Normal Values, offering a seamless blend of functionality and user-friendliness that caters to the dynamic needs of healthcare professionals. Here's why Carepatron is the go-to platform for CMP Normal Values Chart management:

Simplified practice management

Carepatron's health coach software streamlines patient data management, making it easier for healthcare providers to access and interpret CMP results. This simplification extends to various aspects of healthcare management, including nurse scheduling and psychiatrist practice management.

Ease of use

Our telehealth platform is designed to focus on user experience. Its intuitive interface means healthcare providers can spend more time on patient care than navigating complex software systems. This ease of use is a core feature of Carepatron's counseling software and life coaching software.

Comprehensive compliance

With global security standards such as HIPAA, GDPR, and HITRUST, Carepatron ensures that all patient data, including CMP test results, are handled with the utmost security and confidentiality. This compliance is critical for all healthcare software, including occupational therapy software and psychology practice management software.

Collaboration-friendly

Carepatron fosters better sharing and collaboration across healthcare teams, professional networks, and clients. Whether sharing CMP Normal Values with a colleague or discussing patient care strategies, the platform facilitates efficient communication.

Global trust and reliability

Serving a worldwide community of healthcare professionals, Carepatron is committed to delivering a consistently high-quality experience. Its global practice management system is trusted by a diverse range of healthcare providers, ensuring they have the best tools.

Carepatron provides an all-encompassing solution for managing CMP Normal Values. Its blend of simplicity, compliance, collaboration, and global reliability makes it an invaluable asset in healthcare management.

General Practice Software

References

Brown, S. S., & Bruns, D. E. (2021). Advances in laboratory standardization and precision. Clinical Chemistry, 67(1), 143-152.

Johnson, L. R., et al. (2020). Epidemiological basis for the definition of normal values in blood. Clinical Epidemiology, 12, 107-115.

Lee, G., & Daniels, V. (2019). Clinical application of the CMP normal values in disease management. Journal of Internal Medicine, 285(4), 410-422.

Miller, W. G., et al. (2018). Review and update of the CMP normal values. Annals of Clinical Biochemistry, 55(3), 281-297.

Smith, J. A. (2019). Historical perspectives on the development of normal values. Journal of Clinical Pathology, 72(5), 328-332.

Who typically requests a CMP Normal Values Chart?

Commonly asked questions

Who typically requests a CMP Normal Values Chart?

Healthcare providers, including doctors and laboratory technicians, commonly request this chart.

When are CMP Normal Values Charts used?

CMP Normal Values Charts are used during routine health screenings, to monitor existing conditions, or to investigate specific symptoms.

How are CMP Normal Values Charts used?

CMP Normal Values Charts are used to compare a patient's lab results with standard reference ranges to identify abnormalities.

How long does a CMP Normal Values Chart take?

The time to obtain results can vary, but typically it takes a few hours to a day after the blood sample is collected.

Join 10,000+ teams using Carepatron to be more productive

One app for all your healthcare work