


What is a Normal ECG Values Chart?
An electrocardiogram (ECG), also known by the initials "EKG," is a measurement of the electrical activity of the heart. It is used to detect abnormal rhythms of the heart, such as arrhythmia, and can help diagnose conditions like congestive heart failure, cardiac hypertrophy, or an enlarged left ventricle. The ECG measures the heart's electrical activity by assessing the voltage or current changes in the chest area. A graph is then created that displays the electrical activity of the heart.
An ECG can provide valuable information about a person's overall cardiovascular health and is often used to monitor patients with existing cardiovascular conditions. It can also indicate if a person has experienced recent events, such as a heart attack.
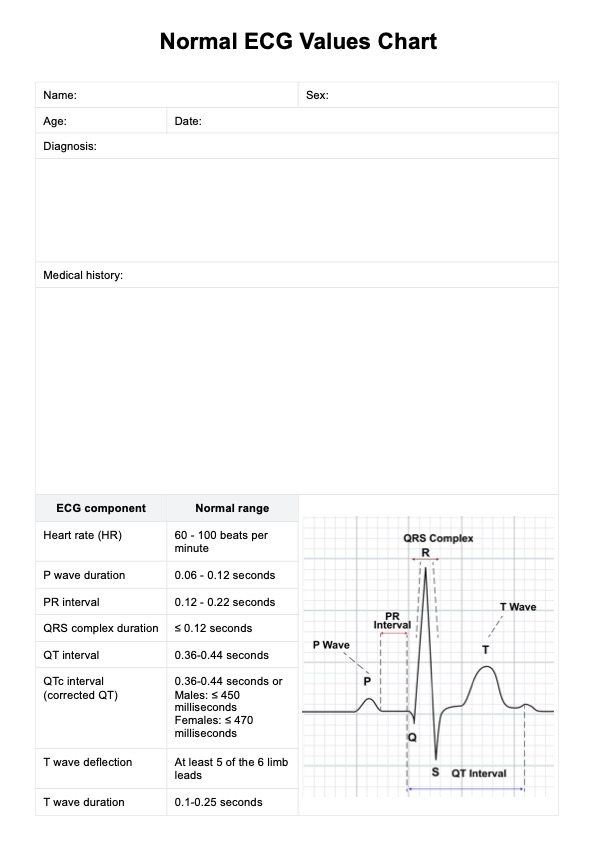
A Normal ECG Values Chart is used to interpret ECG results. This chart contains commonly accepted values for normal ECG readings, which can then be compared against the patient's results to determine if any irregularities exist.
While the Normal ECG Values Chart can help diagnose and monitor patients, it is important to remember that each patient is unique and may present with abnormal ECG readings differently. In such cases, further testing or more specialized evaluations may be necessary to better understand the patient's health. Additionally, ECG readings can vary depending on age, gender, and other individual factors.


