What is an Amsler Grid Chart?
Macular degeneration is an eye disease that affects millions of people worldwide. It can be both age-related and hereditary, but in either case, it results in vision loss due to damage to the macula – a part of the retina responsible for our central vision. Symptoms include dark or blurry spots at the center of the field of vision, difficulty reading or driving, and colors that appear faded.
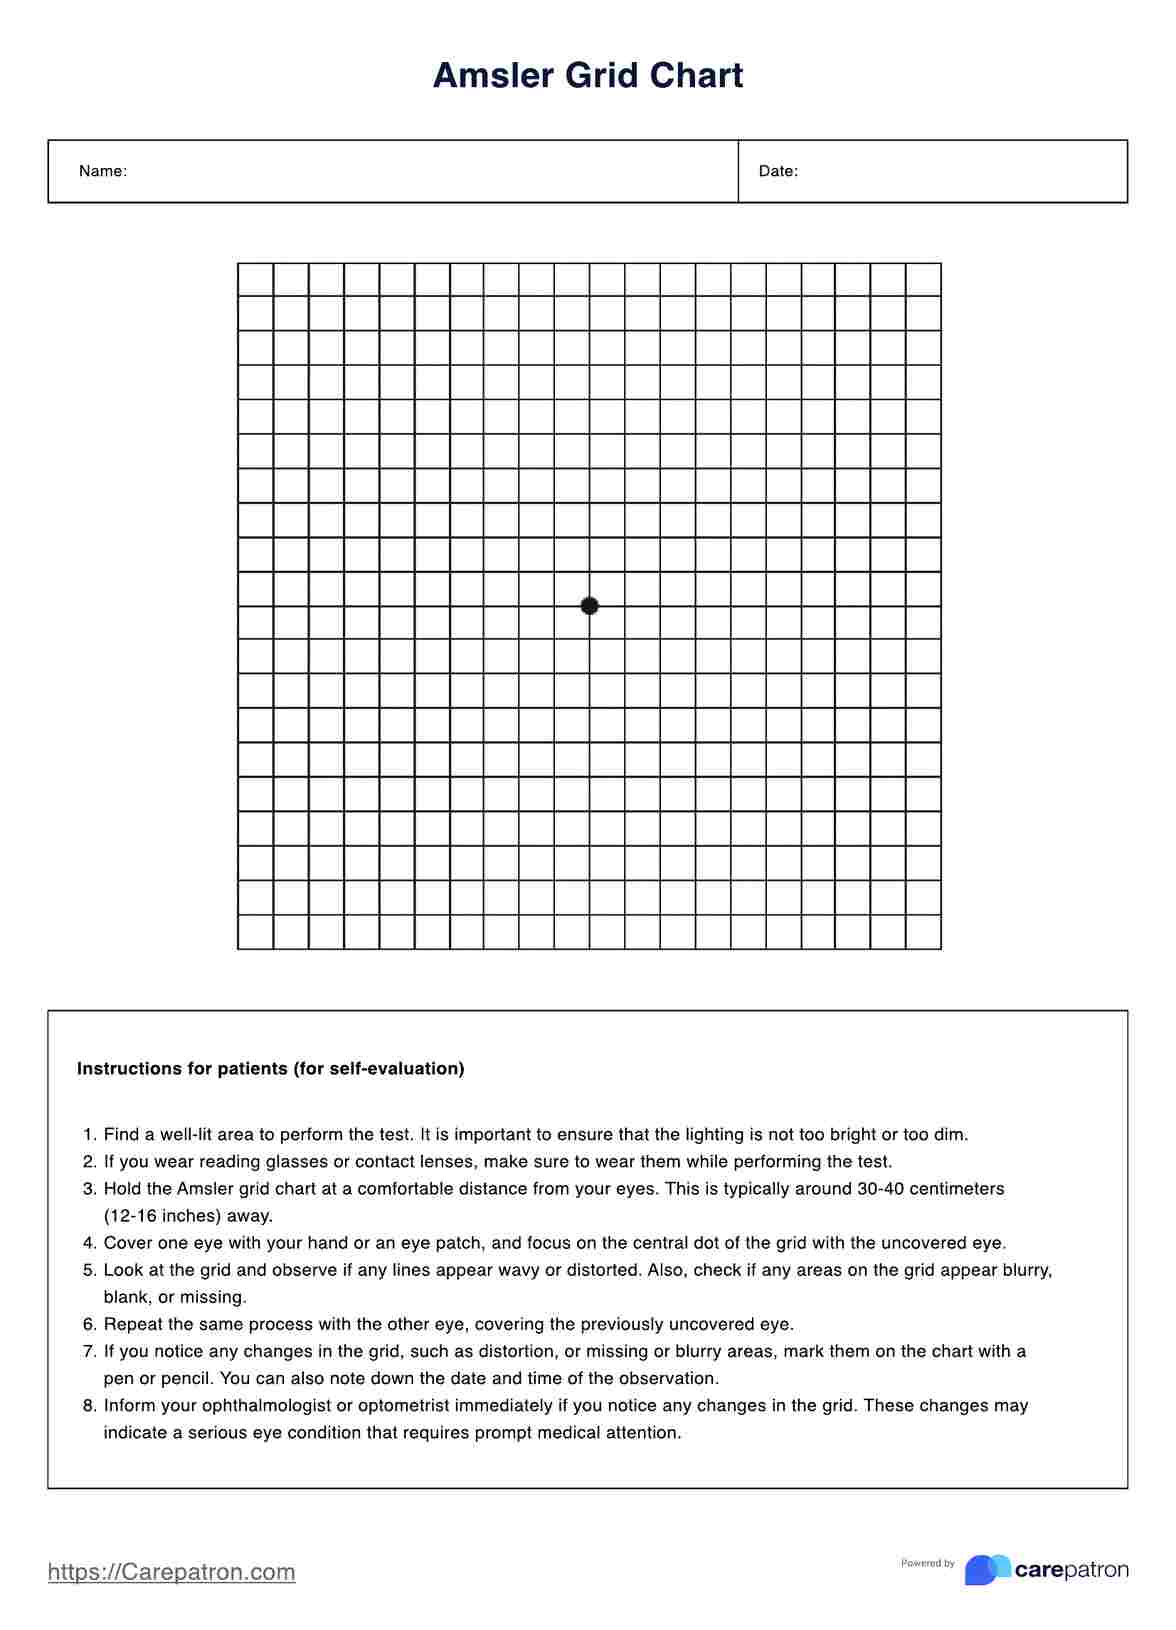
Eye care professionals such as optometrists and ophthalmologists use an to monitor macular degeneration. This chart comprises a 10x10 grid with horizontal and vertical lines and a dot in the center. The patient is asked to look at the chart with one eye while the other remains closed and tell them if any lines appear wavy or distorted or if any boxes are missing. If there are discrepancies, it could be a sign that the patient has macular degeneration.
The Amsler Grid Chart was developed by Marc Amsler in 1947 and has since become a standard tool for evaluating vision. He also designed the Amsler Grid Apparatus, a stereoscope with two grids on the same plane, which allows for more precise testing and assessment.