Knee Pain Location Chart

Zero in on the correct diagnosis of knee pain for your patients using our simple, visual knee pain location chart based on the photographic knee pain map developed by Elson et al (2011).

By Alex King on Apr 08, 2024.

Fact Checked by Nate Lacson.

Use Template

What is a Knee Pain Location Chart?

A is a visual tool to assist with the localization of a patient’s knee pain.

The location of pain in the knee can help give a healthcare practitioner clues as to the cause of the pain. This could be damage to the structures that make up the knee joint, such as ligaments, articular cartilage, or menisci, or it could be due to an underlying disease such as osteoarthritis or gout.

Therefore, the primary purpose of this knee pain location chart is to help your patients identify where they are experiencing pain and, as a result, allow you to narrow down the range of possible diagnoses.

Printable Knee Pain Location Chart

Download this Knee Pain Location Chart and assess your client’s knee pain.

How does this Knee Pain Location Chart work?

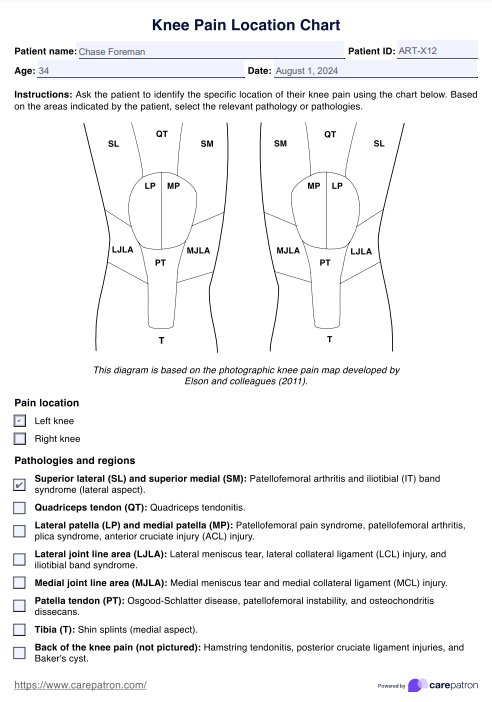
The predominant feature of this knee pain location chart is the diagram of the left and right knees, based on the photographic knee pain map developed by Elson et al.1

Step One. Annotate Knee Diagram

This diagram includes a simplified, visual representation of both the left and right knees and some small labels for the different regions of the knee. Each region was identified as clinically relevant to certain common knee pathologies1. While the pathologies given below are not always limited to these regions, they can be a good starting point for narrowing down diagnoses. 

Some of the common pathologies and their associated regions of the knee are:

SL- Superior Lateral and Superior Medial

  • Patellofemoral arthritis
  • IT band syndrome (lateral aspect)

QT- Quadriceps Tendon

  • Quadriceps tendonitis

LP- Lateral Patella and MP- Medial Patella

  • Patellofemoral Pain Syndrome
  • Patellofemoral arthritis
  • Plica syndrome
  • ACL injury

LJLA- Lateral Joint Line Area

  • Lateral meniscus tear
  • LCL injury
  • Iliotibial band syndrome

MJLA- Medial Joint Line Area

  • Medial meniscus tear
  • MCL injury

PT- Patella Tendon

  • Osgood-Schlatter Disease
  • Patellofemoral instability
  • Osteochondritis dissecans 

T- Tibia

  • Shin splints (medial aspect)

Back of Knee Pain

  • Hamstring tendonitis
  • PCL injury
  • Baker’s cyst

In addition to these pathologies, certain conditions may also result in pain across two or more of these regions of the knee. These conditions include cruciate ligament pathology, extensor tendinopathy, or osteoarthritis. 

Step Two. Add extra notes in the space provided

Once the knee diagram has been annotated to represent the patient’s knee pain accurately, any additional notes can be added in the space provided. These could include any other relevant information, referral plans, or next steps for the patient.

Step Three. Store the chart securely

The last step is to store the chart securely as part of your patient’s medical record. 

Knee Pain Location Chart example (sample)

To see an example of how this knee pain location chart can help your patients to identify where they have pain, just look at our example knee pain location chart. In this example, the patient is experiencing knee pain localized to the medial joint line area and medial patella. Read the example below, or download it as a PDF. 

Download this Knee Pain Location Chart Example (Sample) here:

Knee Pain Location Chart example (sample)

When to use a Knee Pain Location Chart PDF?

As we mentioned earlier, there are many professionals who may see patients with knee problems, and all of these practitioners can utilize this knee pain location chart at various stages of their clinical practice. A knee pain location chart will likely be used at a patient’s initial appointment or assessment. However, it may also be used as a progress tool for physical therapists to monitor the effectiveness of treatment and the patient's progress. 

Who is this Printable Knee Pain Location Chart for?

This knee pain location chart is a visual tool that can help patients and clinicians localize the patient’s pain on a two-dimensional illustration of a knee. While knowledge of common knee pathologies and anatomical terms is required to interpret the result of the knee pain location chart, the activity of circling/shading the area that hurts on the illustration does not. As such, this chart can be completed independently by patients, but a healthcare practitioner will be required to interpret the results and determine the best cause of action. Some of these professionals might include:

  • Physiotherapists
  • Physical therapists
  • Sports medicine physicians
  • Paramedics
  • Orthopedic surgeons and nurses
  • Occupational therapists
Physical Therapy Software Feedback

Why use this Knee Pain Location Chart in Carepatron?

Carepatron is a simple-to-use and comprehensive software solution that saves you time on your practice’s administration work. Automate your patient’s email or SMS appointment reminders, utilize our smart dictation software, and offer your patients their own Carepatron portal to book appointments with you and access their medical records.

Carepatron offers all the modern features you’d expect from state-of-the-art practice management software, such as superbill automation, telehealth appointment functionality, and integrated medical coding. But in addition to this, Carepatron has curated a library of pre-made, customizable resources for practitioners, including this knee pain location chart, which can all be accessed from within Carepatron’s template library.

When you sign up to Carepatron not only can you access all of these templates seamlessly, but you’ll join a community of passionate healthcare practitioners who are committed to delivering the best possible service to their patients.

Physical Therapy Software

References

1. Elson DW, Jones S, Caplan N, Stewart S, St Clair Gibson A, Kader DF. The photographic knee pain map: locating knee pain with an instrument developed for diagnostic, communication and research purposes. Knee. 2011 Dec;18(6)

Who created the knee pain location chart?

Commonly asked questions

Who created the knee pain location chart?

This knee pain location chart is based on the work of Elson et al. (2011), which you can read more about using the reference provided below. This chart is slightly different as it is presented as a simplified 2D tool without the knee photograph. This makes it simpler to annotate however you like and is more printer-friendly for those who prefer to provide physical copies of this chart.

Why is a knee pain location chart popular?

Knee pain location charts have become popular due to their ability to allow patients to identify where they hurt without needing to know complex anatomical terminology. This tool divides the knee into discrete regions in a simple, two-dimensional representation, allowing easy annotation of the location and type of pain being experienced.

What if my patient is experiencing pain in more than one location?

This is a common occurrence for patients experiencing knee pain, and many conditions, such as osteoarthritis or cruciate ligament injuries, can cause pain in multiple regions of the knee. In these cases, your patient’s knee pain chart will have many regions highlighted as being painful- which is still a useful tool for ruling out more localized pathologies!

Join 10,000+ teams using Carepatron to be more productive

One app for all your healthcare work