
What is a genogram?
Have you ever stared at a genogram with symbols and lines, unsure of what they all mean? Genograms, while powerful tools for understanding family dynamics, can appear like the cryptic language you must decode at first glance. Unlike family trees that list names and birth years, genograms go much more in-depth, using symbols and lines to show biological or legal connections and emotional and relational ties.
Healthcare practitioners familiar with genograms find that genograms will help them in more ways than one. Here are some of the reasons why genograms are useful:
- Risk assessment: Practitioners can measure an individual's susceptibility to certain illnesses by precisely notating hereditary conditions. This reduces the risk of oversight and sharpens the focus on preventive measures.
- Patient dialogue: Discussing family history can be sensitive. A genogram facilitates these conversations by offering an organized and sensitive approach to discussing familial patterns without overwhelming the patient.
- Multidisciplinary coordination: When multiple professionals are involved in care, a genogram ensures that everyone understands the patient's background.
- Mental health insights: Marking the nature of relationships and noting any psychological disorders helps practitioners gain deeper insight into the patient's mental and emotional environment, which can inform therapeutic approaches.
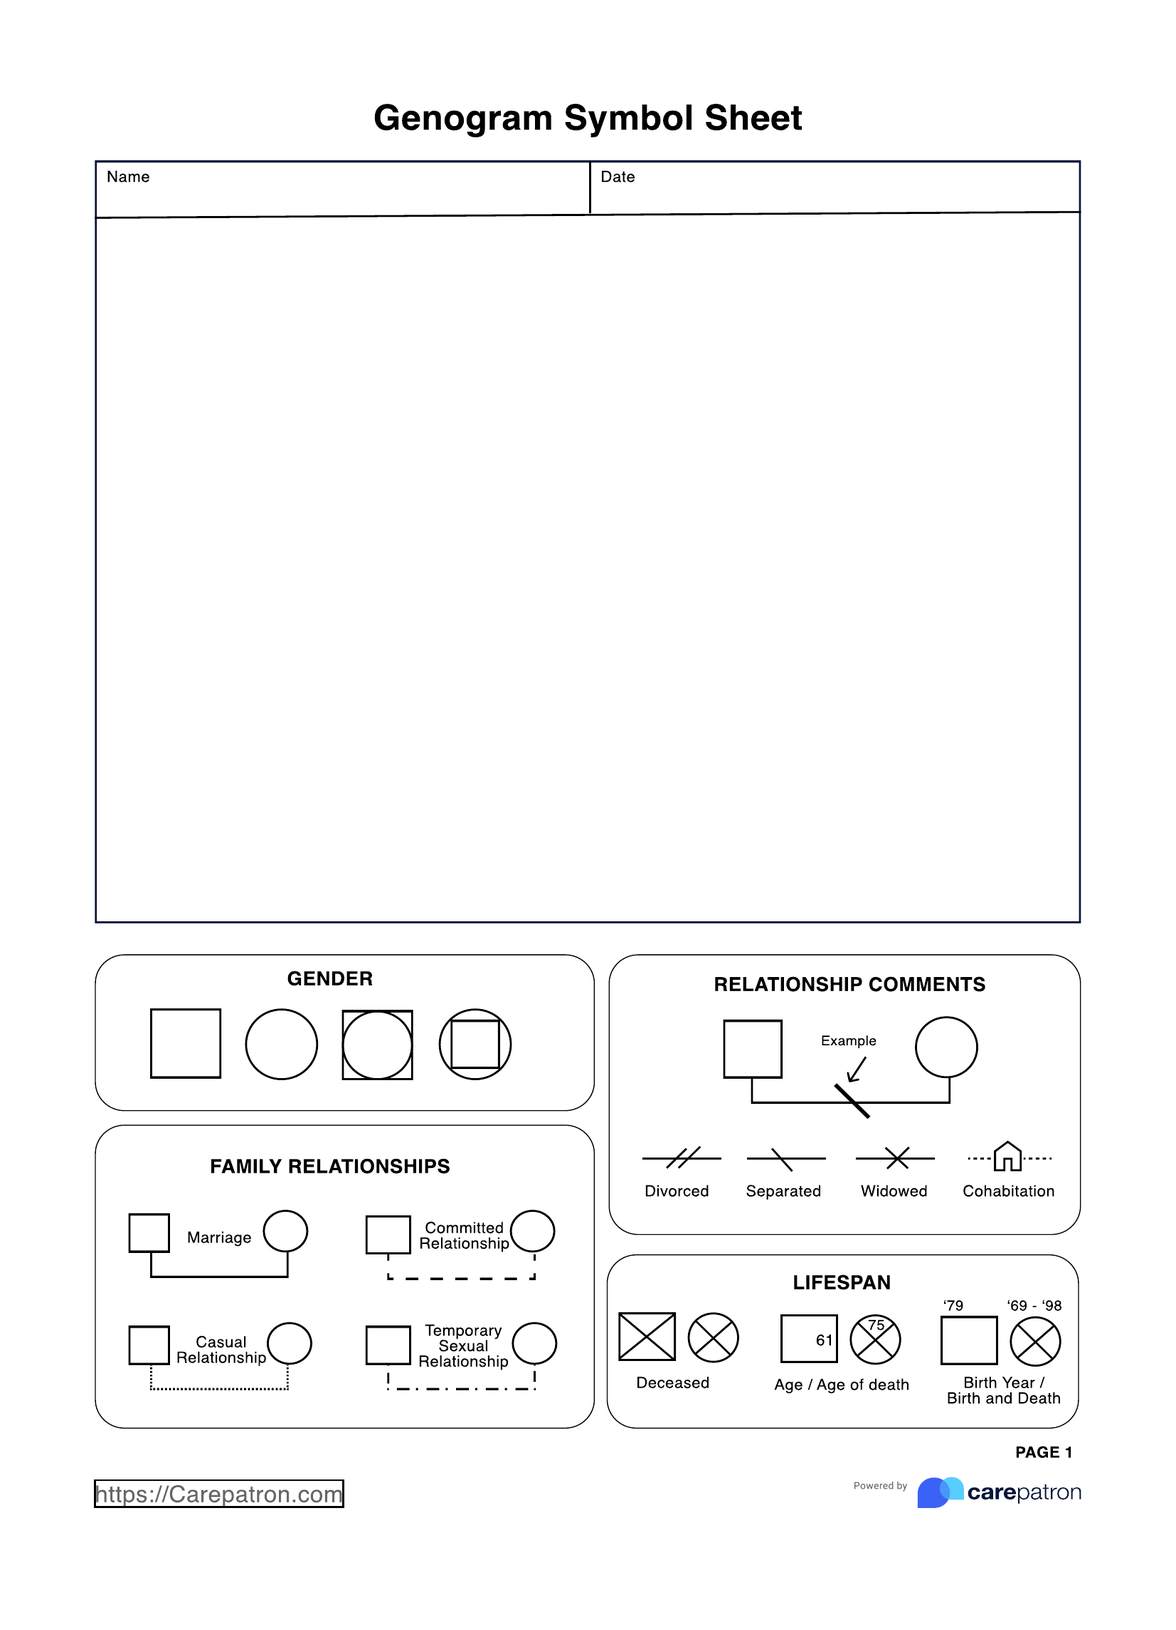
Key components of a genogram
A genogram consists of the following components:
- Symbols: Genogram symbols are straightforward yet informative. Typically, males are represented by squares and females by circles. Other symbols might represent non-binary or transgender individuals, reflecting modern inclusiveness in medical and social research.
- Lines and connections: The connections between individuals are shown using various lines. Solid lines might represent biological or marital connections, while dashed lines could indicate foster relationships or adoptions. Additionally, emotional relationships are annotated with specific lines, such as a zigzag line, to depict a strained or volatile relationship.
- Health and psychological data: Perhaps most crucial for healthcare settings, genograms can illustrate medical histories, hereditary traits, psychological factors, and even lifestyle choices like smoking or alcohol consumption. This is typically done using color coding or adding specific icons following an individual, such as a heart for heart disease or a wheelchair symbol for disabilities.


