Looking for a resource to help you refresh your memory on ECG abnormalities? Read our guide to learn more about ECG abnormalities. Then, use our ECG Abnormalities Chart whenever you need a reference or resource for more accurate diagnoses.
## **An overview of ECG and ECG abnormalities**
An electrocardiogram (ECG or EKG) is a non-invasive medical test that records the electrical activity of the heart over a period of time using electrodes placed on the skin. Each heartbeat is triggered by an electrical impulse that travels through the heart's chambers, causing them to contract and pump blood (ECG Patterns | Critical Diagnostic Skills for Doctors, 2024).
On an ECG, these impulses appear as a specific pattern of waves: the P wave (atrial contraction), the QRS complex (ventricular contraction), and the T wave (ventricular recovery) (Clinic, 2017). A "normal" sinus rhythm typically indicates a heart rate between 60 and 100 beats per minute with consistent intervals between these waves (What Does Normal ECG and Abnormal ECG Mean? - Sunfox Technologies, 2024).
Abnormalities in an ECG occur when these wave patterns are disrupted, often pointing to specific underlying cardiovascular issues. For example, a prolonged PR interval may indicate a "heart block," where electrical signals are delayed between the upper and lower chambers. Beyond structural problems, certain changes, like peaked T waves, can even alert clinicians to metabolic issues such as dangerously high potassium levels (hyperkalemia) (SH, 2026).
## **What is an ECG Abnormalities Chart?**
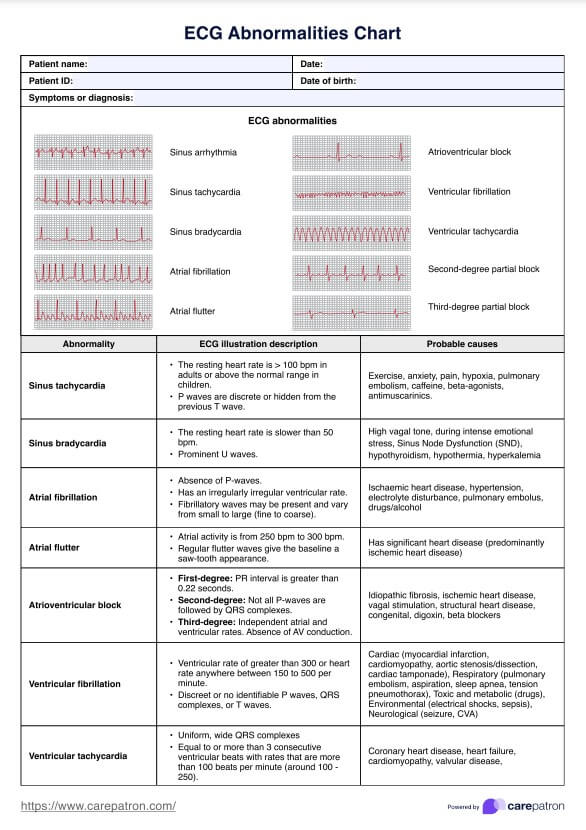
An ECG Abnormalities Chart is a valuable resource that healthcare professionals use to quickly and accurately identify deviations from the heart’s normal electrical activity. The chart helps distinguish between normal rhythm and various abnormal heart rhythms. The chart serves as a visual guide, providing detailed information on common electrocardiogram (ECG) abnormalities, their associated waveforms, and possible underlying causes. This chart is particularly useful for clinicians who need to interpret ECGs regularly, as it enables them to recognize and differentiate between normal and abnormal heart rhythms more efficiently.
It typically includes illustrations of abnormal waveforms, along with descriptions of each abnormality, such as atrial fibrillation, atrial flutter, ventricular tachycardia, sinus bradycardia, sinus tachycardia, bundle branch blocks, 1st to 3rd-degree AV block, and ST-segment elevation, T wave inversion, or depression. Additionally, the chart may cover specific abnormal findings related to electrolyte imbalances, drug effects, or structural heart diseases.
The ECG Abnormalities Chart template is a valuable resource for healthcare professionals involved in diagnosing and managing heart-related conditions. This template can be utilized in a variety of settings and situations to improve the accuracy and efficiency of electrocardiogram interpretation. Here are some instances when using this template would be appropriate:
- **Medical education**: The ECG Abnormalities Chart template serves as an excellent teaching tool for medical students, nursing students, and other healthcare trainees learning to interpret ECGs. The visual representations and descriptions of various abnormalities facilitate better understanding and retention of information.
- **Primary care**: Primary care providers, such as general practitioners and family medicine physicians, may encounter patients with suspected cardiac issues, such as coronary artery disease, during routine consultations. Having this template readily available enables them to quickly identify potential problems and initiate appropriate management or referral.
- **Emergency departments**: In emergency settings, prompt and accurate ECG interpretation is crucial for the timely diagnosis and treatment of life-threatening conditions like acute heart rhythms, arrhythmias, or ventricular fibrillation. The template can assist emergency medicine clinicians in rapidly recognizing abnormal findings and implementing necessary interventions, such as applying carotid sinus pressure.
- **Cardiology clinics**: Cardiologists and other specialized healthcare professionals working in cardiology clinics can use the ECG Abnormalities Chart Template as a reference during patient evaluations, ensuring a thorough and accurate assessment of ECG findings.
- **Hospital wards**: Nurses and other healthcare staff responsible for monitoring hospitalized patients’ ECGs can use the template to detect any concerning changes in real-time, allowing for prompt escalation of care if needed.
- **Remote or telemedicine consultations**: The template can be particularly useful for healthcare professionals who provide remote consultations or telemedicine services. By having this resource at their fingertips, they can efficiently assess ECG findings and offer appropriate guidance or recommendations.
## **How does the ECG Abnormalities Chart template work?**
Here's how to use our template:
### **Step 1: Obtain the Printable ECG Abnormalities Chart template**
To get started, you'll need to acquire a printable ECG Abnormalities Chart template by clicking the links or the buttons - "Use Template" or "Download PDF" - within this guide.
### **Step 2: Familiarize yourself with the chart**
Before using the common ECG Abnormalities Chart, take some time to familiarize yourself with its content and layout. This will enable you to quickly reference the information when analyzing an ECG. Pay attention to the different QRS complexes and waveforms - from P waves to Q waves and even T waves - including those indicating sinus rhythm, their descriptions, and potential underlying causes from the provided abnormal ECG examples.
### **Step 3: Compare the ECG findings to the chart**
Upon obtaining an ECG recording, meticulously analyze the waveforms and contrast them with the illustrations and descriptions in the ECG Abnormalities Chart Template. Identify any discrepancies from normal electrical activity, including irregular heart rhythms, changes in the QRS complex, and the presence or absence of the P wave, Q wave, T wave, and even R wave.
### **Step 4: Identify specific abnormalities with abnormal ECG examples**
Using the chart as a guide, determine if any specific abnormalities are present in the ECG. These may include electrolyte imbalances, drug effects, or structural heart diseases. Make note of your findings for further evaluation and discussion with other healthcare professionals.
### **Step 5: Document your observations**
After identifying any ECG abnormalities, document your observations in the patient's electronic health record or medical chart. Be sure to include the specific abnormality, its potential cause, and any recommended actions or follow-up tests.
You can elevate your practice and client outcomes with the help of this medical chart template.
### **Step 6: Communicate your findings**
Share your findings with the patient and other members of the healthcare team. Discuss the potential implications of the identified abnormalities and collaborate on developing an appropriate treatment plan.
## **Additional resources**
Looking for more heart or cardiovascular related resources to utilize in your practice? Here are some templates you can use and download for free:
- **[Cardiovascular Assessment](https://www.carepatron.com/templates/cardiovascular-assessment/#app-chapter-one)**: Better understand how to conduct a comprehensive carciovascular nursing assessment with this curated guide and template.
- **[Cardiovascular Review of Systems](https://www.carepatron.com/nb-NO/templates/cardiovascular-review-of-systems)**: Evaluation your patient’s cardiovascular condition and make better clinical decisions with our Cardiovascular Review of Systems template.
- **[Heart Rate Recovery](https://www.carepatron.com/nb-NO/templates/heart-rate-recovery/)**: Obtain vital insights on your patient’s cardiovascular fitness by comparing their heart rate with our Heart Rate Recovery Chart.
## **References**
Clinic, C. (2017, September 6). An EKG test checks your heart’s electrical activity to diagnose heart problems. There are different types of EKGs. This test is painless and only takes minutes. Cleveland Clinic. https://my.clevelandclinic.org/health/diagnostics/16953-electrocardiogram-ekg
ECG Patterns | Critical Diagnostic Skills for Doctors. (2024, July 12). Tricog Health. https://tricog.com/common-ecg-patterns/#:~:text=An%20electrocardiogram%20(ECG%20or%20EKG,capturing%20the%20heart's%20electrical%20activity.
SH, T. (2026). Common Abnormalities Found in an ECG and What They Mean. Swasthhriday.in; Swasth Hriday. https://swasthhriday.in/en/blog/cardiac-diagnostics/ecg/common-abnormalities-found-in-ecg-what-they-mean
What does Normal ECG and Abnormal ECG mean? - Sunfox Technologies. (2024, January 8). Https://Sunfox.in. https://sunfox.in/blogs/what-does-normal-ecg-and-abnormal-ecg-mean/#:~:text=A%20normal%20ECG%20is%20seen,to%20100%20beats%20per%20minute.