Bilirubin Levels Newborn
Discover how Bilirubin Levels Newborn Charts can help you determine the best course of action for a neonate with symptoms of jaundice.
What is a Bilirubin Levels Newborn Chart?
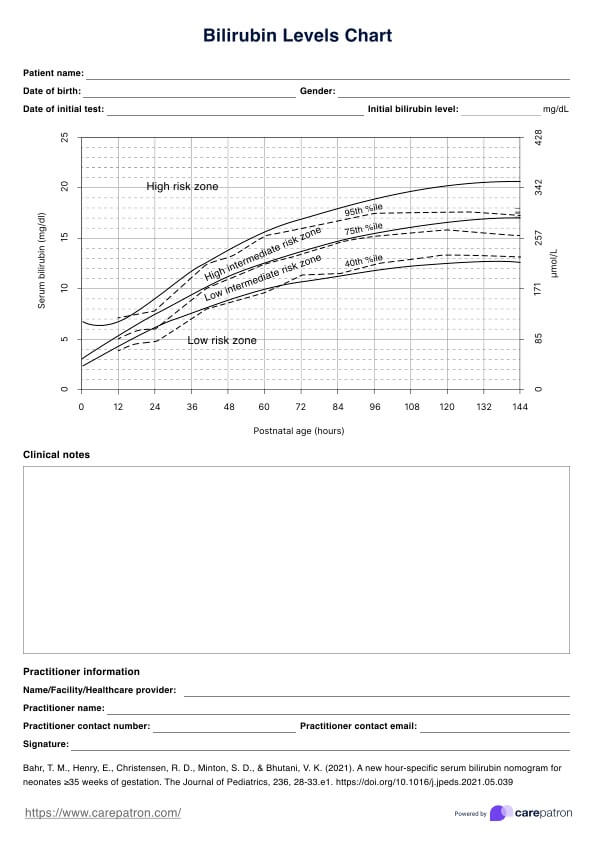
A Bilirubin Levels Newborn Chart is a trusted tool used by healthcare professionals to track the changing levels of bilirubin in a neonates bloodstream. High levels of bilirubin can often lead to a common condition seen in newborns: jaundice. When your body breaks down red blood cells, a yellow substance is created - this is bilirubin. The liver is in charge of removing bilirubin; however, when there is an excess amount of bilirubin in the bloodstream, the neonates skin appears yellow.
During pregnancy, the mother’s liver does all the hard work of removing bilirubin for the baby. After birth, the baby’s liver needs to control that removal, and issues may arise if the liver is underdeveloped.
Jaundice is a common neonate condition and typically resolves itself within a few weeks. However, medical professionals will typically monitor the neonates’ bilirubin levels while they are displaying these symptoms. This is where the bilirubin levels newborn chart comes in to help healthcarers to successfully monitor the initial levels of bilirubin, monitor for any changes in bilirubin levels, and plan accordingly for necessary treatment plans.
Printable Bilirubin Levels Newborn Chart
Download this Bilirubin Levels Newborn Chart to improve the clinical care of newborn babies.
How Does it Work?
Step One: Obtain a Bilirubin Levels Newborn Chart
Carepatron offers a printable bilirubin levels newborn chart for healthcare professionals to use when investigating bilirubin levels. Begin the charting process by downloading/printing this chart.
Step Two: Input the Neonate’s Bilirubin Levels
Plot the levels of bilirubin on the chart. This can be done by getting the bilirubin measurement (__mg/dL) and plotting it against the neonate’s age. Carepatron offers a printable version of the bilirubin levels newborn chart to cater to professionals wanting to work collaboratively with parents. Healthcare professionals can also plot the measurements on the system using the chart.
Step Three: Repeat This Process to Gain a Trend Line
Input of bilirubin levels can be repeated for as long as needed. Here you will use other factors to decide with your best clinical judgment of when it is a good time to stop using the chart.
Step Four: Plan for Treatment (If Applicable)
Considering the results and chart line, commencing treatment plans is at the discretion of the healthcare professional giving care to the neonate during this period.
Bilirubin Levels Newborn Chart Example (Sample)
Carepatron is determined to make your life easier when it comes to providing the utmost care to your patients. That’s why we have created an illustrative sample of the Bilirubin Levels Newborn Chart PDF for you to reference.
Download this Bilirubin Levels Newborn Chart Example:

When Would You Use This Chart?
Ultimately, it is most appropriate to use this chart at your medical discretion. The Bilirubin Levels Newborn Chart is most efficiently used when measuring the levels of bilirubin in a neonate. It includes a Y axis of mg/dL and an X axis of age. This helps to create a line chart and visual guide of how the bilirubin levels are progressing.
Early Detection of Jaundice
Typically, it is beneficial to begin using this chart when there are suspicions of jaundice in a neonate. However, this chart can be completed when the first levels of bilirubin are taken as an early detection tool for jaundice.
Treatment Decisions
This template is a visual guide that makes it easier to determine when treatment plans need to commence. Considering whether the chart shows the levels of bilirubin as ascending or descending can aid in making decisions about treatment. There may be too big of a jump between levels, which can also be demonstrated in this chart.
Monitoring Bilirubin Level Progress
This chart can be used for monitoring the bilirubin levels before, during and after treatment (if necessary). Newborns undergoing treatment for jaundice can have their results monitored through this chart to identify how effective the treatment is.
Utilizing this template can help with accurate documentation and act as a visual guide that can help build rapport for parents who might not necessarily understand what all these numbers mean and are worried about their child.
What do the Results Mean?
This Free Bilirubin Levels Newborn Chart gives healthcare providers a visual understanding of how the bilirubin levels in a neonate are checking out.
Full Term Neonates
The threshold for concern is considered to be a bilirubin level of > 18 mg/dL. A result higher than this will typically warrant additional testing.
Preterm Neonates
Premature neonates, along with neonates who may be small for the gestational age or unhealthy, are at a higher risk and treatment may need to be put in place at a lower level. For these babies, it is typical for the threshold to be lower at >10 mg/dL. These results also warrant additional testing.
Chart Results
The results displayed when the chart is finished are essentially a monitored display of the bilirubin levels. When the line tends to be increasing, healthcare professionals can make judgments about what is acceptable for the neonate given other crucial physical factors that are important. Early results may display the concern for the development of jaundice and healthcare professionals will keep a close eye on this.
24-Hour Timeframe
Jewell (2018) notes that if the value begins to rise by a significant amount within 24 hours, there may need to be a serious investigation into what is causing the bilirubin level to be so high. An example of a significant rise within 24 hours is between 2 mg/dL and 8 mg/dL. This also warrants close observation - even though the mg/dL may not be above the threshold.
Research & Evidence
Bilirubin levels charts have been deep-rooted in evidence-based medicine and have become a standardized tool used in the everyday screening of neonates. The use of these bilirubin charts is continuously confirmed by research studies with Petersen et al., (2020) concluding that the use of bilirubin levels charts works to reduce errors made by healthcare providers as well as improve documentation skills.
Bilirubin levels newborn charts have allowed practitioners to closely monitor and suggest treatment options that suit the gestational age of the neonate and mg/dL level of bilirubin. As modern technology has been progressing, the use of bilirubin levels in newborn charts has continued as its use is highly regarded to keep practitioners pushing for adherence to medical guidelines. These charts have been able to be adapted to the changing needs of the medical discipline.
Commonly asked questions
Healthcare professionals caring for neonates who have an open inquiry on their bilirubin levels.
These charts are typically used when there is a suspected case of jaundice in a neonate. However, it is not uncommon for practitioners to use these charts as a screening test for both full-term and premature infants.
The charts are used by plotting data points against the mg/dL and gestational age of the infant to develop a trend line to determine the course of action required.
It is completely up to the discretion of the healthcare professional. Other external factors may mean that the chart is elongated, however, there is no set time frame for how long they can be used for.
Why Use Carepatron as Your Bilirubin Levels Newborn App?
Carepatron is a platform that is designed for modern practitioners. We know how much pesky administrative tasks hold you back from providing the utmost care to your patients. Let us take care of that for you. As a Bilirubin Levels Newborn Chart app, Carepatron is designed to meet the requirements of healthcare practitioners who are required to complete Bilirubin levels charts for neonates.
Using Carepatron as your Bilirubin Levels Newborn Chart Software means you get access to a free printable and downloadable template to help ensure you are providing the care you strive to provide. It is a user-friendly system that helps simplify data entry visual chart interpretations that can help parents of neonates with high levels understand the severity of the condition and allow for documentation requirements in a seamless experience.
The compatibility aspect of Carepatron allows practitioners to collaborate on treatment options and ideas for neonates with high bilirubin levels. It also allows for easy transfer of documents between practitioners within the system.
Join the community of healthcare professionals who are currently relying on Carepatron. Their practice has been elevated thanks to our system. Our system is the best place to complete not only bilirubin levels newborn charts but many other healthcare requirements because we know what it means to be an efficient healthcare professional.

References
Cleveland Clinic. (2022, January 17). Jaundice in Newborns: Symptoms, Causes & Treatment. Cleveland Clinic. https://my.clevelandclinic.org/health/diseases/22263-jaundice-in-newborns
Dysart , K. C. (2021). Neonatal Hyperbilirubinemia. Merck Manual Professional Version. https://www.merckmanuals.com/professional/pediatrics/metabolic,-electrolyte,-and-toxic-disorders-in-neonates/neonatal-hyperbilirubinemia
Jewell, T. (2018, September 17). What Causes High Bilirubin? Healthline; Healthline Media. https://www.healthline.com/health/high-bilirubin
Newborn Jaundice. (2012, April 25). American Pregnancy Association. https://americanpregnancy.org/healthy-pregnancy/first-year-of-life/newborn-jaundice/