What is a Bilirubin Levels Chart?

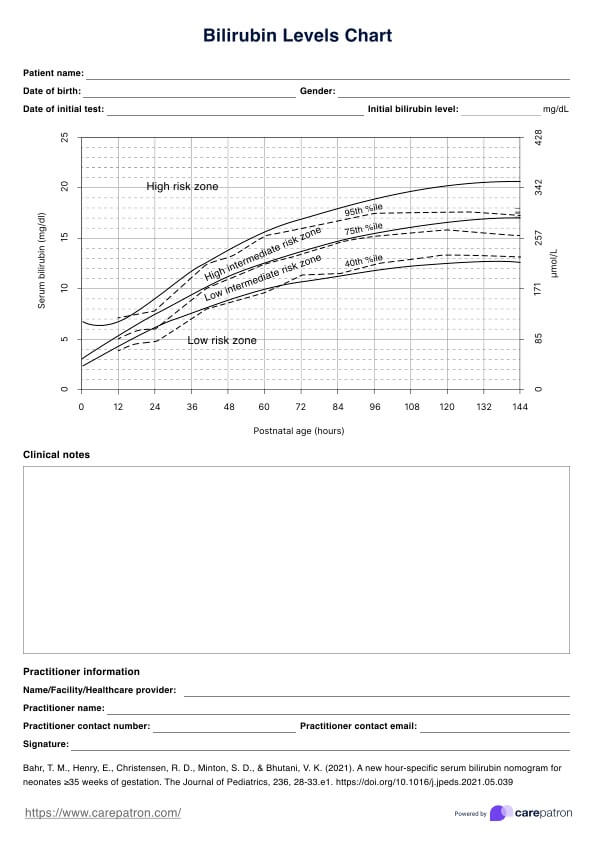
A Bilirubin Levels Chart evaluates the total amount of serum bilirubin in an individual's bloodstream. This chart aids healthcare professionals in diagnosing a common condition in infants: jaundice and other diagnoses in adults.

Jaundice is a yellow discoloration of the skin and eyes caused by hyperbilirubinemia (an elevated serum bilirubin concentration) in the newborn’s blood. This condition is considered normal in almost all newborns. Around 60% of full-term infants and as many as 80% of premature infants will develop jaundice during their first week of life. If Jaundice appears outside the normal range, healthcare providers will take necessary steps to reduce those levels.

During pregnancy, the woman’s liver removes bilirubin for the baby. Once born, the infant’s liver will begin removing the bilirubin. The infant’s bilirubin level will be the highest when they are around three to five days old. Monitoring of bilirubin in the newborn’s blood can be done using a bilirubin levels chart. Healthcare professionals will plot the bilirubin level against the newborn’s age in days. This can give the practitioner a visual view of how the bilirubin level is progressing.

Although jaundice is the most common condition of high bilirubin levels in neonates, high bilirubin in adults can be a sign of a more serious underlying condition:

  • Gallstones
  • Gilbert’s Syndrome
  • Liver dysfunction
  • Hepatitis
  • Pregnancy
  • Bile duct obstruction

A bilirubin levels chart helps healthcare professionals make judgments about the necessary treatment that may need to be carried out to decrease the levels of bilirubin.

Printable Bilirubin Levels Chart

Download this Bilirubin Levels Chart to evaluate the total amount of serum bilirubin in an individual's bloodstream.

How Does it Work? 

Step One: Determine Potential Heightened Bilirubin Levels

A physical exam of the infant should be conducted. The practitioner will inspect the skin for the extent of jaundice. This is typically done by gentle pressure on the skin to help reveal the presence of the condition.

Step Two: Take Necessary Medical Steps

Levels of bilirubin can be taken through typical measurements used in medical practice. Once the initial blood test returns, the healthcare professional can plot the levels of bilirubin found in the bloodstream against the individual's age.

Step Three: Complete the Bilirubin Levels Chart

Use Carepatron’s printable Bilirubin Levels Chart to get a clear visual of how the bilirubin level is progressing within the individual. Repeat the process as many times as medically needed. The graph will begin to take shape, and practitioners will be able to see a progression line as the graph continues to be filled in.

Step Four: Plan for Appropriate Treatment

Utilize the data gathered on the bilirubin levels chart to make necessary treatment decisions based on the bilirubin levels.

Bilirubin Levels Chart Example (Sample) 

We have created a digitally accessible and printable Bilirubin Levels Chart PDF template. Here, you can gain more insight into what it will look like when you fill this chart in. The progression line in this chart example is for reference only.

Download this Bilirubin Levels Chart Example: 

When Would You Use This Chart?

Newborn Screening

The levels of bilirubin may be checked when the child is born as a part of the newborn screening protocols. This initial screening can ensure early recognition of newborns at risk of developing jaundice.

Suspected Cases of Jaundice

Practitioners may use this chart when there is a suspected case of jaundice in an infant. This will help in making future decisions and investigating the underlying causes of this common condition.

Monitoring

Bilirubin level charts can be used by healthcare professionals to adequately monitor the increasing, decreasing, or stabilized levels of bilirubin in the individual. This is usually undertaken through the infant’s first few days to weeks after birth.

Treatment Decisions

The cause of heightened bilirubin levels may need tailored care. Using the bilirubin levels chart can help practitioners decide how values are displayed and what the next steps should be.

Clinical Follow-ups and Aftercare

Practitioners can use bilirubin levels charts to make sure the levels of bilirubin are decreasing following treatment. They may also decide to use these charts to make sure that the levels are returning to a safe level for the individual to return home.

What do the Results Mean?

Using Carepatron’s free Bilirubin Levels Chart, practitioners can visualize the individual’s bilirubin levels against their age to determine if there is a need to intervene to return to a safe level. Higher bilirubin levels will lead the newborn to have Jaundice between the first and third day after birth. In these cases, bilirubin will typically reach a peak of 18 mg/dL during their fourth and fifth day, and Jaundice will usually decrease and clear up within 14 days as their liver continues to mature.

Healthy results for children who are aged 15 days to 18 years old should fall less than 1.0mg/dL.

An adult bilirubin level should fall between 0.2 and 1.2 mg/dL. Any level that returns above 1.2 mg/dL is typically considered elevated by healthcare professionals.

There is a critical need to understand the cause of an elevated bilirubin value. Rossiaky (2018) acknowledges that if the value rises by a certain amount within a 24-hour timeframe, healthcare professionals will have a heightened cause for concern. 

For example, Suppose an infant has a bilirubin level of 3 mg/dL on day one but a bilirubin level of 10 mg/dL on day two. In that case, this can indicate a need for close monitoring by medical professionals. 

High bilirubin levels in an individual’s blood show that the liver is not filtering the bilirubin as it should. This does not mean that there is damage to that individual’s liver. In the case of newborns, the cause of this is usually Jaundice. In adults, there could be underlying problems that are unrelated to the functioning of the liver that may raise the body’s bilirubin level. 

Research & Evidence

Bilirubin level charts are rooted in evidence-based medicine and have become a standardized tool that practitioners use in everyday screening for neonates and individuals who present with symptoms. Bilirubin charts continue to be affirmed by research studies that focus on jaundice risk factors and liver function. Petersen et al. (2020) concluded that using bilirubin levels charts in healthcare in the risk assessment process may help reduce clinicians' errors, improve documentation, and push for adherence to guidelines.

Bilirubin level charts have allowed practitioners to come together and find treatment options that can significantly impact individuals presenting with heightened bilirubin symptoms. As modern technology has progressed, bilirubin-level charts have been adapted to the ever-changing medical discipline with high regard for healthcare.

Commonly asked questions

Who typically requests a Bilirubin Levels Chart?

Any healthcare professional who is caring for an individual who may have Jaundice. Typical practitioners may include:

·  Pediatricians

·  Laboratory technicians

·  Neonatal nurses

·  Midwives

·  General practitioners

When are Bilirubin Levels Charts used?

These charts are typically used when there is a suspected case of Jaundice in an individual.

How are Bilirubin Levels Charts used?

Bilirubin level charts help the healthcare professional monitor and make decisions for future treatment.

Why Use Carepatron as Your Bilirubin Levels App?

Carepatron is a platform designed for modern practitioners. We know how much you value your limited time with your patients. As a bilirubin-level app, Carepatron is designed to meet the healthcare professionals' needs to carry out bilirubin tests.   

Carepatron’s Bilirubin Levels app provides healthcare professionals with a specialized solution for continuous monitoring of bilirubin levels in an individual. It is a user-friendly system that helps with data entry, physical chart interpretations, and future treatment decisions. The bilirubin levels chart software helps practitioners with documentation requirements and allows seamless integration into their workplace and patient care.

Carepatron offers an aesthetic template that makes it easy for healthcare workers to see the bilirubin levels physically. It helps guide treatment plans and strengthens the rapport between practitioners by aiding the understanding of acceptable levels of bilirubin. Parents of infants with Jaundice and individuals with heightened bilirubin levels will appreciate the easy-to-understand template that healthcare professionals use when they use Carepatron’s system.

Carepatron’s compatibility helps practitioners to make notes and aids in collaborative work between different departments that may be involved in further procedures in the treatment of the individual.

Our system is the best place to do bilirubin level charts because we know what it means to be a healthcare professional who values their work and time with their patients who deserve the utmost care.

Practice Management Software

References

4.6 High Risk -Neonatal -Jaundice in the newborn Version 7; Approved xxx 2012 Guideline Jaundice in the newborn: screening and assessment Key points Screening & assessment. (2012). https://www.england.nhs.uk/wp-content/uploads/2015/07/jaundice-in-the-newborn.pdf

Cleveland Clinic. (2022, January 17). Jaundice in Newborns: Symptoms, Causes & Treatment. Cleveland Clinic. https://my.clevelandclinic.org/health/diseases/22263-jaundice-in-newborns

Felson, S. (2017, March). What Is a Bilirubin Test? WebMD; WebMD. https://www.webmd.com/a-to-z-guides/bilirubin-test

Jaundice neonatal. (2022). Pch.health.wa.gov.au. https://pch.health.wa.gov.au/For-health-professionals/Emergency-Department-Guidelines/Jaundice-neonatal

Jewell, T. (2018, September 17). What Causes High Bilirubin? Healthline; Healthline Media. https://www.healthline.com/health/high-bilirubin#causes

Newborn Jaundice. (2012, April 25). American Pregnancy Association. https://americanpregnancy.org/healthy-pregnancy/first-year-of-life/newborn-jaundice/

Petersen, J. D., Lozovatsky, M., Markovic, D., Duncan, R., Zheng, S., Shamsian, A., Kagele, S., & Ross, M. K. (2020). Clinical Decision Support for Hyperbilirubinemia Risk Assessment in the Electronic Health Record. Academic Pediatrics. https://doi.org/10.1016/j.acap.2020.02.009

Rossiaky, D. (2018, September 17). High Bilirubin Levels: Symptoms, Causes, and Treatment. Healthline. https://www.healthline.com/health/high-bilirubin#fa-qs

Who typically requests a Bilirubin Levels Chart?
Written by

Join 10,000+ teams using Carepatron to be more productive

One app for all your healthcare work