What Are Thyroid Hormones?

Below the Adam’s Apple is a small butterfly-shaped gland called the Thyroid Gland. This gland produces Thyroid Hormones, mainly Thyroxine (sometimes called T4) and Triiodothyronine (sometimes called T3). These hormones play essential roles in our body, precisely the following:

  • Digestion and Metabolism: they convert the food that we eat into energy. The higher the amount of these hormones, the higher our metabolism gets, which also means an increase in energy usage.
  • Weight Regulation: by way of energy expenditure, thyroid hormones help us regulate our body weight
  • Blood Pressure Regulation: they help balance our blood pressure and keep it at normal levels, and by extension, they also help regulate our heart rate.
  • Internal Temperature Regulation: these hormones also help regulate our body temperature by influencing how much body heat is produced and dissipated
  • Growth: these hormones influence the development of our hair, nails, and skin

The Thyroid Gland works alongside the Hypothalamus and the Pituitary Gland. The Hypothalamus releases Thyrotropin-releasing Hormones (sometimes called TRH for short). These hormones nudge the Pituitary Gland to release Thyroid-stimulating Hormones (sometimes called TSH for short), which stimulate the Thyroid Gland to release T3 and T4.

Downloadable Thyroid Normal Range Chart PDF here

Check out our free Thyroid Normal Range Chart PDF for enhanced health

How To Use a Thyroid Normal Range Chart

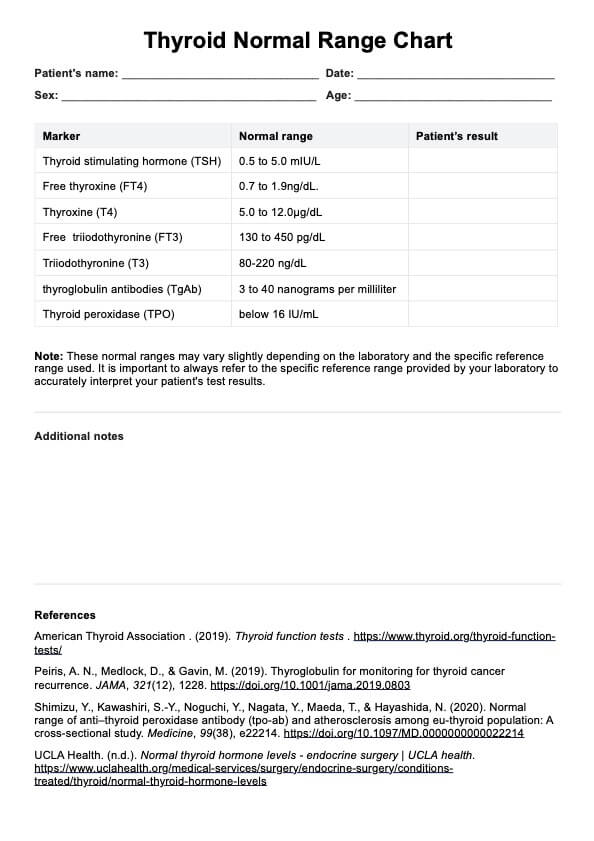
A Thyroid Normal Range Chart is a table that shows healthcare professionals and their patients the normal ranges of Thyroxine, Triiodothyronine, and Thyroid-stimulating Hormones. They also indicate the normal levels of Thyroid Antibodies: Thyroid Peroxidase (TPO) and Thyroglobulin Antibodies (TgAb).

The former is an enzyme that emerges whenever the immune system mistakenly attacks the Thyroid Gland. Abnormal elevations in TPO indicate a thyroid-related autoimmune condition, like Hashimoto’s Disease.

The latter is an antibody that attacks Thyroglobulin, the protein the Thyroid Gland makes. These antibodies have the potential to destroy the Thyroid Gland. Abnormal elevations in TgAb also indicate a thyroid-related autoimmune condition.

Thyroid Normal Range Charts are a reference they can whip out when needed, especially when reading thyroid test results and explaining the findings to patients. All they need to do is look at the chart to help them with their interpretations and decision-making based on the results.

How To Interpret Thyroid Normal Ranges

Thyroid Normal Range Charts show the following:

  • Thyroid-stimulating Hormone (TSH)
  • Total T4
  • Free T4 (active T4)
  • Total T3
  • Free T3 (active T3)
  • TPO
  • TgAb

They indicate the normal and optimal ranges a patient should have.

Depending on the results, they will have any of the following: Hyperthyroidism, Hypothyroidism, pituitary disease, and Hashimoto’s Disease, to mention a few.

Here are examples of interpretations:

  • High TSH but low T4 and T3: primary hypothyroidism
  • High TSH but normal/optimal levels of T4 and T3: subclinical hypothyroidism
  • Low TSH but high T4 and T3: primary hyperthyroidism
  • Low TSH but normal/optimal T4 and T3: mild hyperthyroidism
  • Low TSH but low T4 and T3: pituitary disease

Please note that normal and optimal ranges depend on the laboratory producing the results.

Thyroid Normal Range Chart Example (Sample)

Healthcare professionals normally have this chart in their office, or they’ve memorized the normal/optimal levels set by their laboratory. Still, it’s normal to have mental blocks now and then. If you’ve been a healthcare professional for a long time or are newly minted, you can download our free Thyroid Normal Range Chart PDF template!

This template comes with what you’d expect from a chart. It shows the normal ranges and the optimal levels a patient must have to be considered healthy relative to thyroid-related factors.

We have set sample normal and optimal ranges, but we made each section editable in case your laboratory has preset normal and optimal ranges.

Here’s what it looks like:

Download our Thyroid Normal Range Chart Example PDF here

Thyroid Normal Range Chart Example

If you like what you see and believe this will help you when compiling thyroid test results, please download our free Thyroid Normal Range Chart PDF template.

When Is It Best To Use Thyroid Normal Range Charts?

You can use a Thyroid Normal Range Chart during the following:

Thyroid Function Testing and Diagnosis

Thyroid Normal Range Charts are best when assessing a patient's thyroid function. You can input your laboratory’s preset normal and optimal ranges on the editable portions of our template and then cross-check the results of your patient’s thyroid function test.

If they fall outside the reference ranges, that would mean they possibly have a thyroid dysfunction that you can confirm and diagnose after further testing.

Routine Check-ups

Thyroid Function Tests are often part of routine check-ups, whether patients visit a clinic or hospital for a required annual physical examination or check-ups because they have a family history or history of thyroid dysfunction.

By having the chart ready, professionals can immediately interpret how their patient is faring concerning their thyroid function every visit.

Patient Monitoring

Suppose a patient gets diagnosed with a thyroid dysfunction/condition like Hypothyroidism or Hyperthyroidism. This chart can be used during monitoring check-ups to see if their thyroid hormones are regulated and falling on normal/optimal levels.

Can we immediately diagnose a person with thyroid dysfunction using the Thyroid Normal Range Chart?

Commonly asked questions

Can we immediately diagnose a person with thyroid dysfunction using the Thyroid Normal Range Chart?

No. You must conduct other thyroid-related tests to confirm the possibility of thyroid dysfunction and then diagnose their specific thyroid problem. The chart is for helping you determine if your patient’s thyroid hormone levels and antibodies are in the normal/optimal ranges.

How come laboratories have varying reference ranges for their Thyroid Normal Range Charts?

It’s likely due to differences in the populations they’ve studied, especially the locations of those populations. Each lab might have different testing methods, too. This is why we made our template editable so you can input your lab's normal/optimal reference ranges.

Can thyroid function tests be performed on the spot?

It depends. Most doctors schedule this because it would be best for patients to indicate if they’ve been taking certain medications. These might affect the results. Besides, they don’t have to fast unless they’re taking other tests alongside the thyroid function test.

Join 10,000+ teams using Carepatron to be more productive

One app for all your healthcare work