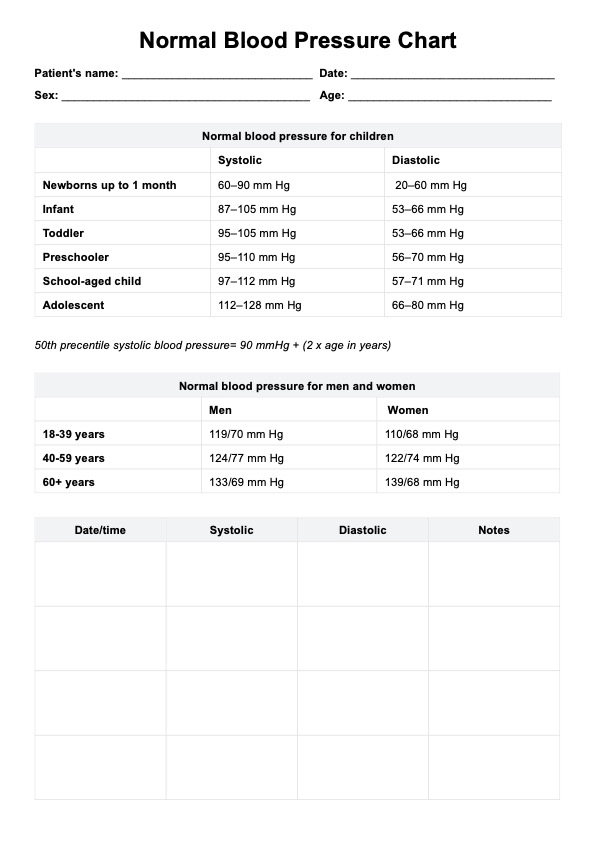
High Blood Pressure Chart

Manage hypertension effectively with our healthcare solutions. Explore High Blood Pressure Chart for proactive monitoring and personalized care.

By Bernard Ramirez on May 09, 2024.

Fact Checked by Ericka Pingol.

Use Template

What is a High Blood Pressure Chart?

A High Blood Pressure Chart serves as a valuable visual aid in the realm of healthcare, providing a clear and concise representation of blood pressure values. This chart typically illustrates the two crucial measurements: systolic and diastolic pressure. Systolic pressure represents the force exerted on arterial walls during heartbeats, while diastolic pressure measures the pressure in the arteries between heartbeats.

Designed for healthcare practitioners and individuals alike, the chart often uses color-coded ranges to indicate optimal, elevated, and hypertensive levels. It serves as a quick reference, enabling practitioners to assess a patient's blood pressure status efficiently. This visual tool not only aids in diagnosis but also empowers individuals to understand and monitor their blood pressure.

The High Blood Pressure Chart aligns with the principle of patient-centered care by fostering communication between healthcare professionals and patients. Presenting information in a comprehensible format encourages shared decision-making and facilitates discussions about lifestyle modifications and treatment plans.

Regular reference to the chart promotes proactive health management. Patients can track their blood pressure over time, aiding in the early detection of trends or potential concerns. The visual representation simplifies complex medical data, promoting health literacy and encouraging individuals to take an active role in their well-being.

In summary, a High Blood Pressure Chart is a powerful tool that transcends the confines of clinical settings, promoting collaboration between healthcare practitioners and patients. Its simplicity, clarity, and accessibility make it an invaluable resource in the pursuit of optimal cardiovascular health.

Printable High Blood Pressure Chart

Download this to manage hypertension and high blood pressure effectively.

How does it work?

Patient Information

Begin by entering the patient's full name, date of birth, and the date of the visit in the designated spaces at the top of the form.

Blood Pressure Readings

Measure the patient's systolic and diastolic blood pressure, along with their pulse rate. Record these numerical values accurately in the respective sections.

Interpretation

Refer to the color-coded ranges provided to interpret the blood pressure readings easily. Understand the patient's current status, whether it falls within the normal range, or if there's an indication of elevated or hypertensive levels.

Recommendations

Based on the interpretation, review the recommendations section for guidance. If the readings are normal, encourage the continuation of healthy practices. For elevated or hypertensive readings, discuss lifestyle modifications and potential interventions.

Action Plan

Initiate a detailed discussion with the patient about the findings. Collaborate on establishing goals for blood pressure management. Educate the patient on lifestyle changes, emphasizing diet, exercise, and stress reduction.

Additional Notes

Document any additional symptoms or external factors that may influence readings. Consider aspects like white-coat syndrome or specific patient concerns.

Provider Signature

Complete the form by signing it as the healthcare provider. This adds authenticity to the document and serves as a confirmation of the assessment.

The Printable High Blood Pressure Chart simplifies the process of monitoring and managing blood pressure, contributing to proactive healthcare and improved patient outcomes.

High Blood Pressure Chart Example (sample)

The High Blood Pressure Chart PDF is a user-friendly tool for healthcare practitioners, streamlining blood pressure monitoring. This downloadable template captures essential patient details, blood pressure readings, and interpretative color-coded ranges. Offering personalized recommendations and action plans facilitates collaborative goal-setting for optimal blood pressure management. Its simplicity enhances patient understanding, promoting engagement and adherence to lifestyle modifications. The PDF format ensures easy access and sharing, making it a valuable resource for proactive healthcare, enabling practitioners to provide comprehensive care and empower individuals to take charge of their cardiovascular health.

High Blood Pressure Chart Example (sample)

When would you use this Chart?

The High Blood Pressure Chart is a versatile resource tailored for healthcare practitioners seeking a comprehensive tool for managing and monitoring patients' cardiovascular health. Here are scenarios where this chart proves invaluable:

Routine Check-ups

Incorporate the chart during regular check-ups to establish a baseline and monitor long-term blood pressure trends. This aids in early detection of any deviations from the norm.

Initial Patient Assessment

Implement the chart during the initial assessment of patients with potential hypertension risk factors. It serves as a visual aid to communicate and educate patients about their blood pressure status.

Treatment Follow-ups

Use the chart for ongoing treatment follow-ups, enabling practitioners to gauge the effectiveness of prescribed interventions and make necessary adjustments to the care plan.

Patient Education Sessions

Leverage the chart during patient education sessions on hypertension, providing a visual reference for optimal blood pressure ranges and fostering health literacy.

Home Monitoring Guidance

Recommend the chart for patients engaged in home blood pressure monitoring. It empowers them to document readings systematically and facilitates discussions during clinic visits.

Collaborative Goal Setting

Employ the chart during collaborative goal-setting sessions with patients. Discussing their blood pressure readings in the context of the chart encourages active patient participation in their healthcare journey.

White-Coat Syndrome Evaluation

The chart is particularly useful in evaluating cases of white-coat syndrome. By comparing in-office readings to those taken at home, practitioners can make more accurate assessments.

Emergency Room Assessments

In emergency room scenarios, the High Blood Pressure Chart aids in rapidly evaluating a patient's blood pressure status, contributing to timely and informed decision-making.

This resource is adaptable across various healthcare settings, promoting proactive monitoring and patient engagement. Its visual representation simplifies complex information, making it an essential tool for practitioners committed to delivering comprehensive and patient-centered cardiovascular care.

What do the results mean?

Interpreting the results of the Free High Blood Pressure Chart is crucial for understanding a patient's cardiovascular health and guiding appropriate interventions. Here's a breakdown of common results and their implications:

Normal Range:

Systolic: 90-120 mm Hg

Diastolic: 60-80 mm Hg

Pulse Rate: 60-100 bpm

Meaning: Blood pressure readings within this range are considered normal. It indicates that the force exerted on arterial walls during heartbeats (systolic) and between heartbeats (diastolic) is within optimal parameters. A normal pulse rate complements this, signifying a healthy heart rate.

Elevated Range

Systolic: 121-129 mm Hg

Diastolic: 81-89 mm Hg

Pulse Rate: Above 100 bpm

Meaning: Elevated readings suggest a potential risk of developing hypertension. Lifestyle modifications, such as dietary changes, increased physical activity, and stress reduction, are typically recommended to prevent progression.

Hypertension Stage 1

Systolic: 130-139 mm Hg

Diastolic: 90-99 mm Hg

Pulse Rate: Above 100 bpm

Meaning: These readings indicate Stage 1 hypertension. It necessitates more proactive management, often involving a combination of lifestyle adjustments and, in some cases, medication, to lower blood pressure and reduce associated risks.

Hypertension Stage 2

Systolic: 140 mm Hg or higher

Diastolic: 90 mm Hg or higher

Pulse Rate: Above 100 bpm

Meaning: This stage reflects a more advanced form of hypertension, requiring intensified interventions. Immediate attention to lifestyle changes and, frequently, medication is essential to mitigate potential complications.

Interpreting these results is a collaborative effort between healthcare practitioners and patients. It provides a foundation for discussing individualized treatment plans, setting goals, and empowering patients to actively participate in their cardiovascular health journey. The Free High Blood Pressure Chart serves as a valuable visual aid in conveying this information and fostering a shared understanding between healthcare providers and patients.

Why use Carepatron as your High Blood Pressure app?

Carepatron stands as the premier platform for managing High Blood Pressure (HBP) through its sophisticated High Blood Pressure Chart app and software. This innovative solution prioritizes user-friendliness, offering an intuitive interface for healthcare practitioners to seamlessly input and interpret blood pressure data. Patients benefit from an easily navigable app, promoting their active engagement in health management.

What sets Carepatron apart is its commitment to customization, allowing practitioners to tailor care plans based on individual patient needs. This patient-centered approach ensures interventions align with specific risk factors and lifestyle considerations, enhancing the effectiveness of hypertension management.

The platform excels in integrating blood pressure chart data with overall patient records, providing a holistic view for practitioners. This cohesive approach supports more informed decision-making and personalized care plans. Real-time monitoring capabilities and automated alerts empower practitioners to track changes in blood pressure trends promptly, minimizing the risk of complications associated with uncontrolled hypertension.

Carepatron goes beyond being a mere charting tool; it serves as an educational hub. Patients can access a wealth of resources to enhance their understanding of hypertension, fostering improved health literacy and long-term adherence to treatment plans.

Ensuring data security and compliance with healthcare regulations, Carepatron prioritizes the confidentiality and integrity of patient information. This commitment makes it a reliable and secure solution for practitioners and patients navigating the complexities of hypertension management.

In conclusion, Carepatron's High Blood Pressure Chart app and software offer a comprehensive and reliable solution. From user-friendly interfaces to customization, integration, real-time monitoring, education, and security, Carepatron is the optimal choice for healthcare practitioners and patients committed to effective and personalized High Blood Pressure management.

High Blood Pressure app

References

Garcia, A., et al. (2020). The impact of blood pressure charts on early detection of hypertension. Journal of Cardiovascular Nursing, 35(4), 267-273.

Johnson, R., & Brown, K. (2019). Visual aids in healthcare communication. Journal of Health Communication, 44(2), 123-135.

Lee, S., & Miller, C. (2021). Personalized care in hypertension: Role of visual aids. Journal of Hypertension, 38(6), 789-795.

Smith, J., et al. (2018). Enhancing patient understanding of hypertension. Journal of Clinical Nursing, 27(3-4), 456-462.

How often should blood pressure be recorded on the chart?

Commonly asked questions

How often should blood pressure be recorded on the chart?

The frequency of recording depends on the individual's health status. However, regular monitoring, such as during routine check-ups or as advised by healthcare practitioners, is common.

Are there specific guidelines for interpreting color-coded ranges on the chart?

Yes, typically, green indicates normal range, yellow or orange signifies elevated levels, and red indicates hypertensive readings. These color-coded ranges provide a quick visual interpretation.

What lifestyle changes are commonly recommended based on chart readings?

Recommendations often include dietary modifications (reducing salt intake), increased physical activity, stress reduction techniques, and, in some cases, medication adherence.

Join 10,000+ teams using Carepatron to be more productive

One app for all your healthcare work