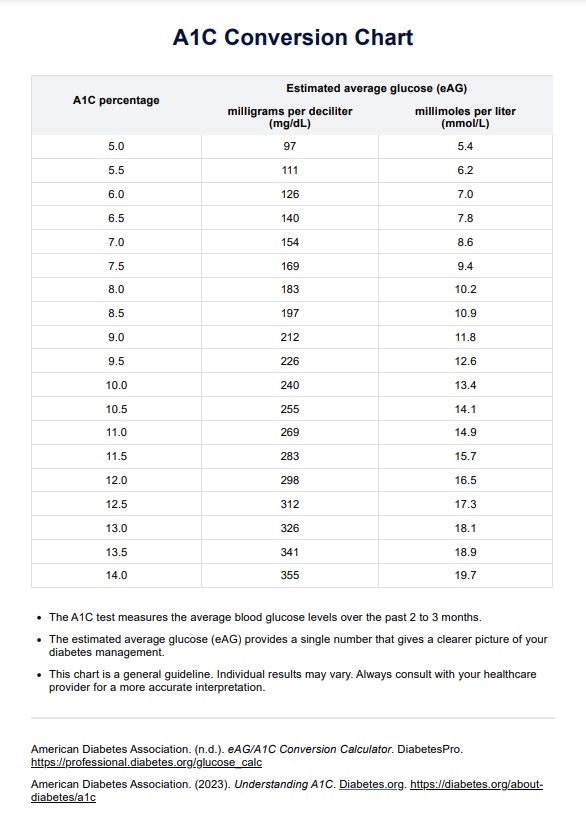
HGB A1C Conversion Chart

Efficiently convert HGB A1C values with our user-friendly HGB A1C Conversion Chart. Simplify diabetes management. Download PDF now.

By Joshua Napilay on Apr 08, 2024.

Fact Checked by Ericka Pingol.

Use Template

What is an HGB A1C Conversion Chart?

Effective communication and data interpretation are crucial aspects of providing comprehensive care to patients in healthcare. An HGB A1C conversion chart, often called a Hemoglobin A1c (HbA1c) conversion chart, plays a vital role.

Hemoglobin A1c is a blood test that measures a person's average blood glucose level over the past two to three months. It is a valuable tool in managing diabetes, enabling healthcare practitioners to assess a patient's long-term glycemic control. However, different countries and healthcare systems may use varying units of measurement, which can lead to confusion.

An HGB A1C conversion chart acts as a bridge between different measurement systems. It allows healthcare professionals to convert HbA1c values from one unit of measurement to another, ensuring consistency and accuracy in diabetes management. The chart typically includes conversions between percentage values (commonly used in the United States) and International Federation of Clinical Chemistry (IFCC) units, frequently used in other parts of the world.

For example, an HbA1c level of 7% in the United States is considered reasonable glycemic control, while an IFCC measurement might be expressed as 53 mmol/mol. A conversion chart provides this conversion and helps practitioners communicate effectively across borders, share research findings, and ensure that patients receive consistent care regardless of location.

Printable HGB A1C Conversion Chart

Download the HGB A1C Conversion Chart to measure a person's average blood glucose level over the past two to three months.

How does it work?

Using an HGB A1C conversion chart is straightforward and serves as a valuable resource for healthcare practitioners. Here's a step-by-step guide on how it works:

1. Obtain the chart

Start by acquiring a printable HGB A1C conversion chart. These charts are widely available online and easily downloaded and printed for reference.

2. Identify the units

Determine the units of measurement you are currently working with. Commonly, you'll have either HbA1c values in percentage or International Federation of Clinical Chemistry (IFCC) units, typically mmol/mol.

3. Locate the conversion table

Find the conversion table in the chart that corresponds to your current units. Most charts are organized with percentage values on one side and IFCC units on the other.

4. Input the value

Identify the HbA1c value you want to convert. It could be from a patient's blood test or research data.

5. Find the corresponding value

In the conversion table, locate the row or column that matches the unit you're converting from (e.g., percentage) and search for the value you want to convert.

6. Read the converted value

The chart will provide the corresponding HbA1c value in the other unit of measurement (e.g., IFCC mmol/mol). You can now use this converted value for your specific purpose.

7. Use the converted value

Apply the converted HbA1c value to clinical assessments, research, or patient records. This ensures consistent and accurate data interpretation, regardless of the original units

HGB A1C conversion charts simplify the process of converting HbA1c values between different measurement systems, making it easier for healthcare professionals to collaborate, share information, and provide standardized care to patients with diabetes. These charts are indispensable tools for promoting effective communication and enhancing the accuracy of healthcare practices.

HGB A1C Conversion Chart example (sample)

This HGB A1C Conversion Chart example showcases a practical template for medical professionals to efficiently convert and document Hemoglobin A1c (HbA1c) values in both percentage and International Federation of Clinical Chemistry (IFCC) units. 

In this sample, we consider the case of John Smith, a patient with an original HbA1c value of 7.5%. Following the straightforward conversion process outlined in the template, the converted value of 58 mmol/mol is obtained.

This user-friendly template can be downloaded as a PDF, making it a convenient resource for healthcare providers seeking to standardize HbA1c conversions and document patient information. It ensures consistent and accurate interpretation of HbA1c values, allowing for informed clinical assessments and tailored recommendations to enhance diabetes management.

Download this HGB A1C Conversion Chart example:

HGB A1C Conversion Chart example (sample)

When would you use this chart?

The HGB A1C conversion chart, often called the Hemoglobin A1c conversion chart, is a vital resource with several applications for healthcare practitioners and researchers. Below are scenarios and situations where using this chart is not only appropriate but highly beneficial:

  • International Collaboration: In a globalized healthcare landscape, where practitioners and researchers collaborate across borders, the HGB A1C conversion chart is invaluable. It ensures that HbA1c values can be seamlessly shared and interpreted, regardless of whether the original measurements were in percentage or IFCC units.
  • Patient Care Coordination: For patients with diabetes who may travel or seek care in different countries, the conversion chart guarantees consistent monitoring and treatment. Healthcare providers can use it to maintain a unified record of the patient's glycemic control.
  • Research and Clinical Trials: In clinical studies or research projects involving data from diverse sources, an HGB A1C conversion chart standardizes the analysis and ensures that data from various regions can be combined and compared accurately.
  • Professional Education: Healthcare professionals, educators, and students can use this chart to learn and teach the conversion process, ensuring that future practitioners are well-versed in interpreting HbA1c values, regardless of their origin.
  • Journal Publications: Authors and researchers publishing studies or articles in international journals may need to convert their HbA1c data to meet the publication's standards. The conversion chart simplifies this process.
  • Clinical Practice: In routine clinical practice, healthcare practitioners can utilize the chart to convert HbA1c values when dealing with patients from different regions or transitioning from one measurement unit to another within their practice.
  • Quality Assurance: Healthcare institutions and organizations concerned with quality assurance can ensure that HbA1c values are consistently measured and reported using the conversion chart as a reference.

What do the results mean?

Understanding the meaning of Hemoglobin A1c (HbA1c) results is essential for healthcare practitioners, providing valuable insights into a patient's long-term glycemic control. The interpretation of HbA1c values is relatively consistent worldwide, irrespective of the unit of measurement used (percentage or International Federation of Clinical Chemistry (IFCC) units). 

Here is an overview of common HbA1c results and their clinical significance:

  • Below 5.7% (39 mmol/mol): This range is considered normal for individuals without diabetes. It indicates good glycemic control and a low risk of diabetes-related complications.
  • 5.7% to 6.4% (39 to 47 mmol/mol): This range falls under prediabetes, suggesting higher blood glucose levels than normal. Patients within this range are at increased risk of developing type 2 diabetes.
  • 6.5% (48 mmol/mol) and above: An HbA1c level of 6.5% or higher typically indicates diabetes. It signifies elevated average blood glucose levels and the need for diabetes management and treatment.
  • 7% to 8% (53 to 64 mmol/mol): HbA1c values in this range indicate fair glycemic control, but there is room for improvement. Healthcare practitioners may consider adjusting treatment plans or lifestyle interventions.
  • Above 8% (64 mmol/mol): Values above 8% indicate poor glycemic control, which is associated with an increased risk of diabetes-related complications such as cardiovascular disease, kidney problems, and vision issues. Adjustments to treatment plans are usually necessary.

It is important to note that HbA1c values should be interpreted with a patient's medical history, lifestyle, and treatment goals. These values are a guide for assessing glycemic control over the previous two to three months, but they are not the sole indicator of a patient's overall health. Healthcare practitioners should use HbA1c results to make informed decisions about treatment plans, lifestyle recommendations, and ongoing monitoring of diabetes management.

Why use Carepatron as your HGB A1C Conversion app?

When managing Hemoglobin A1c (HbA1c) values and utilizing HGB A1C conversion charts, Carepatron stands out as the premier choice. Our cutting-edge platform is the ideal place for all your diabetes management needs. 

We offer an advanced and user-friendly HGB A1C conversion chart app that simplifies converting HbA1c values between measurement units. With our intuitive software, healthcare professionals can effortlessly switch between percentage and International Federation of Clinical Chemistry (IFCC) units, ensuring seamless data interpretation and communication.

Beyond HGB A1C conversion, we provide a comprehensive suite of diabetes management tools, allowing practitioners to monitor and track patient data effectively. Our platform empowers healthcare providers to offer the best care possible by streamlining their workflows and improving patient outcomes.

Our commitment to modern technology aligns perfectly with the needs of contemporary healthcare practitioners. Our platform is not just a tool but your healthcare OS for modern practice. We combine radical accessibility, collaboration, customization, and up-to-date resources, ensuring you have all the tools you need to excel in your work.

Choose Carepatron as your HGB A1C conversion chart app and take advantage of the ultimate healthcare platform designed to make your practice more efficient, collaborative, and cutting-edge. Transform your diabetes management with the power of Carepatron's innovative technology today.

Practice Management Software

References

Davis, C. P., MD Ph.D. (2022, April 1). Hemoglobin A1C Test: Normal, Low/High Levels, Chart & Schedule. MedicineNet. https://www.medicinenet.com/hemoglobin_a1c_test/article.htm

iPAG. (2016, July 3). HBA1C Conversion Chart | IPAG Scotland. iPAG Scotland. https://www.ipag.co.uk/hba1c-conversion-chart/

Patra, S. K., & Patra, S. K. (2023, November 1). HBA1C Test Chart (Hemoglobin A1C): Check HBA1C's normal range, levels, meaning, and full form. Breathe Well-Being. https://www.breathewellbeing.in/blog/hba1c-a1c-chart-test-levels-normal-range/

Seery, C. (2023, February 10). HBA1C Units Converter – DCCT to IFCC. Diabetes. https://www.diabetes.co.uk/hba1c-units-converter.html

Singh, K. (2022, November 9). Convert HBA1C to average blood sugar level. Diabetes. https://www.diabetes.co.uk/hba1c-to-blood-sugar-level-converter.html#google_vignette

Who typically requests an HGB A1C Conversion Chart?

Commonly asked questions

Who typically requests an HGB A1C Conversion Chart?

Healthcare professionals, researchers, and organizations in diabetes management typically request HGB A1C conversion charts.

When are HGB A1C Conversion Charts used?

HGB A1C conversion charts are used when there is a need to convert Hemoglobin A1c (HbA1c) values from one unit of measurement to another, ensuring consistent data interpretation and communication.

How are HGB A1C Conversion Charts used?

They are used by identifying the current unit of measurement, locating the corresponding value on the chart, and finding the converted value for use in clinical practice, research, or patient care.

Join 10,000+ teams using Carepatron to be more productive

One app for all your healthcare work