Hemoglobin levels that fall significantly below the normal range are considered concerning and may indicate anemia. Generally, hemoglobin levels below 12 g/dL in adult women and below 14 g/dL in adult men are considered low and warrant further investigation and potential treatment.
Hemoglobin Level
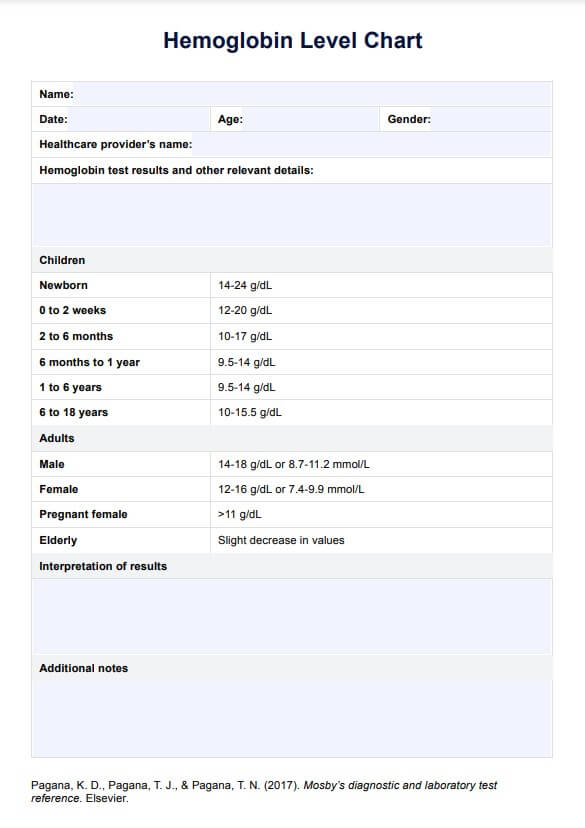
Have a hemoglobin level chart on hand when analyzing and interpreting your patient’s hemoglobin level test results. Click here to download a free template.

Use Template
Hemoglobin Level Template
Commonly asked questions
The lowest acceptable hemoglobin level can vary depending on the individual's age, sex, and overall health status. However, as a general guideline, hemoglobin levels below 10 g/dL are typically considered low and may require medical intervention. Levels below 7 g/dL are considered severe anemia and require prompt treatment.
The normal range for hemoglobin levels in babies can vary based on their age. A hemoglobin level between 14-24 g/dL in newborns is considered normal. By 6 months of age, the normal range is typically 9.5 to 14 g/dL. Healthcare providers monitor infant hemoglobin levels closely to ensure proper red blood cell production and oxygen delivery during this critical stage of development.


EHR and practice management software
Get started for free
*No credit card required
Free
$0/usd
Unlimited clients
Telehealth
1GB of storage
Client portal text
Automated billing and online payments