


What are normal hemoglobin levels?
Hemoglobin is a complex protein molecule found in red blood cells that plays a crucial role in oxygen and carbon dioxide transport throughout the body. It carries oxygen from the lungs to various tissues and helps remove carbon dioxide, making it essential for overall health and well-being (Ahmed et al., 2020).
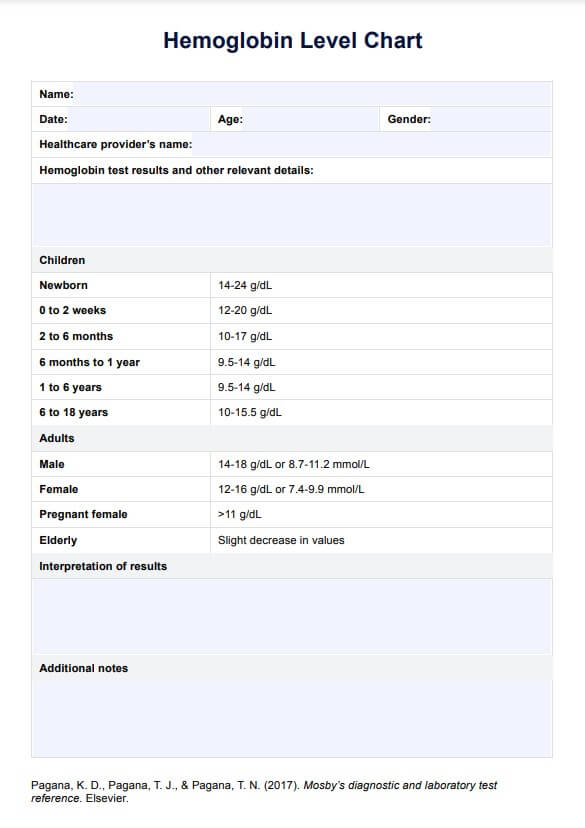
A hemoglobin test measures the amount of hemoglobin in the blood, but this is also typically measured as part of a complete blood count (CBC). The normal range can vary slightly depending on factors such as age, sex, and pregnancy status. Generally, normal hemoglobin levels are:
- Adult men: 14 to 18 g/dL
- Adult women: 12 to 16 g/dL
- Children: 9.5 to 24 g/dL (varies by age)
- Pregnant women: 11.0 to 14.0 g/dL
What affects hemoglobin levels?
When hemoglobin levels fall below the normal range, it may indicate anemia. Common causes of low hemoglobin count and fewer healthy red blood cells being produced in the body include:
- Iron deficiency anemia, sickle cell anemia
- Chronic diseases (e.g., chronic kidney disease, cancer)
- Vitamin deficiencies (B12, folate)
- Blood loss
- Bone marrow disorders
On the other hand, elevated hemoglobin levels can be caused by:
- Dehydration
- Lung diseases
- Congenital heart disease
- Polycythemia vera
- Living at high altitudes
High hemoglobin levels may increase the risk of blood clots and related complications. These irregular levels can also cause issues that lead to fewer red blood cells.


