Eye Chart
Discover our free Printable Eye Chart, designed for eye care professionals looking to test visual acuity. Download your eye chart PDF today!
What is an Eye Chart?
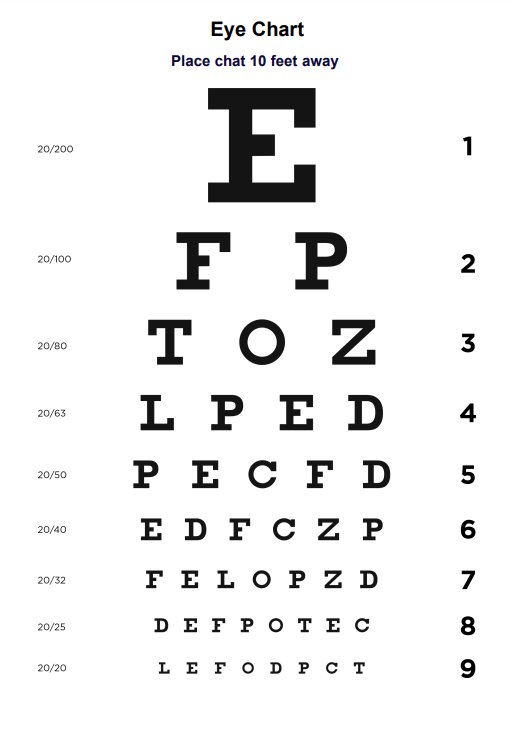
An Eye chart is used by eye care professionals, such as optometrists and ophthalmologists, to measure visual acuity. The most common version is the Snellen chart, developed by a Dutch ophthalmologist in the 1860s. the Snellen chart consists of rows of letters, numbers, or symbols that become progressively smaller from the top to the bottom row.
These charts are a cost-effective way to assess a person's vision and identify potential vision problems, such as nearsightedness, farsightedness, or astigmatism. A healthcare professional will identify the smallest line where a patient can identify most of the letters to assess the extent to which eyesight has deteriorated or if a prescription needs adjusting. Regular eye exams are crucial to maintaining good eye health.
The Printable Eye Chart is a practical tool for optometrists and ophthalmologists to efficiently identify potential vision problems. School nurses can also use an eye chart to for early detection of eyesight problems among older children (who can already read). Community health workers and organizations can use Printable Eye Charts to screen people who may need professional eyesight evaluations.
Early detection of vision problems can help prevent more severe issues and ensure appropriate corrective measures, such as eyeglasses or contact lenses, are prescribed when necessary. In providing an accessible and straightforward way to assess visual acuity, eye charts empower healthcare professionals alike to take proactive steps in preserving eyesight.
Eye Chart Template
Eye Chart Example
How does the Printable Eye Chart work?
Understanding and monitoring visual acuity is essential for maintaining good eye health. Our Printable Eye Chart is a convenient tool for conducting vision screenings at home, in schools, or professional settings. Follow these steps to use the template:
Step 1: Position the chart
Before the eye test, hang the Snellen chart on a well-lit, flat surface at eye level. Ensure the chart is free of glare, shadows, or other visibility obstructions. The chart should be printed in A4 and the person should stand 10 feet (3 meters) from the chart, so ensure you have enough space.
Step 2: Prepare the patient
Ask the person whose vision is tested to stand 10 feet (3 meters) from the chart. If they wear glasses or contact lenses for distance vision, they should keep them on during the eye test. The person should stand facing the chart, with their feet shoulder-width apart.
Step 3: Cover one eye
Instruct the person to cover one eye with an occluder or the palm of their hand, taking care not to apply pressure to the eye. This will allow you to test one eye at a time.
Step 4: Read the chart
Ask the person to read each row of letters on the chart from top to bottom, starting with the largest letter. They should continue reading until they can no longer clearly distinguish the letters on a row. Encourage them to guess if unsure, as this will give you a better understanding of their visual acuity limits.
Step 5: Record the results
Note the smallest line of letters the person can read accurately. This will be their visual acuity measurement for that eye, expressed as a fraction (e.g., 20/20, 20/40, etc.).
Step 6: Test the other eye and both eyes together
Repeat steps 3-5 with the other eye. Finally, ask the person to uncover both eyes and read the chart again. This will give you a measurement of their visual acuity when both eyes work together.
Step 8: Interpret the results
Compare the recorded visual acuity measurements to standard visible acuity levels. This will help you determine if the person's vision is within normal limits or if they may need further evaluation by an eye care professional.
Scoring and interpretation
Eye chart scoring is based on the smallest row of letters that the test taker can accurately read. This is expressed as a fraction, such as 20/20, 20/40, etc. The numerator represents the distance from the chart (20 feet), and the denominator represents the distance from which a person with 'normal' vision could read the same line. For example, if someone has 20/40 vision, it means they can see at 20 feet what a person with normal vision can see at 40 feet.
If they can read the last line, this indicates 20/20 vision (or normal visual acuity). If they cannot read the last row of the Printable Eye Chart, this may indicate they have below-normal vision and may benefit from a comprehensive eye evaluation. For a row to be considered 'visible,' the standard Snellen ratio indicates a person must be able to read 5 out of 6 (approximately 80%) of the letters within a row.
When can you use the Printable Eye Chart tests?
Eye chart tests are versatile tools for assessing visual acuity in various situations and settings. This tool is designed as a quick, approximate version of a Snellen chart, and is not a diagnostic tool or a replacement for a comprehensive eye exam using calibrated eye charts. Here are some specific scenarios where eye chart tests can be beneficial:
Routine vision screenings
Regular vision screenings are essential for detecting vision problems early, ensuring timely intervention and treatment. Eye chart tests can be used as a simple and effective method for screening visual acuity in adults and children, allowing for early detection of issues like myopia, hyperopia, or astigmatism.
Preliminary assessments during an eye exam
Eye care professionals often use eye chart tests as an initial step in a comprehensive eye examination. The results from the chart test provide a baseline for visual acuity, which can be further investigated using more specialized tests and equipment, if necessary.
Monitoring changes in visual acuity over time
Eye chart tests can track changes in an individual's vision over time. This is particularly useful for monitoring the progression of eye conditions or the effectiveness of treatments such as corrective lenses or surgery. It can also help indicate whether a prescription needs adjusting.
Home use
The Printable Eye Chart template can be distributed to patients to use at home during Telehealth appointments or between professional eye exams. This offers a convenient way to monitor vision and help identify any changes that may require further evaluation. It can also help prepare young children for their eye test to reduce anxiety.
School screenings
Eye chart tests are excellent for school nurses and educators to conduct student vision screenings. Early detection of vision problems can significantly impact a child's academic performance and overall well-being.
Community health events
Vision screenings using eye chart tests can be conducted at community events or health fairs to raise awareness about the importance of eye health and provide accessible vision testing to the public.
Clinical settings
The Printable Eye Chart can be useful a clinical setting for healthcare professionals looking to assess visual acuity and detect potential issues that may warrant a referral for a comprehensive ophthalmological evaluation.
Benefits of these Printable Eye Chart templates
Our Printable Eye Chart is an accessible, customizable, and cost-effective tool for healthcare professionals to conveniently test visual acuity in various settings. Here are some of the advantages to using our free Printable Eye Chart:
Accessibility
The Printable Eye Chart is a ready-to-go tool for simple and effective eye testing. The chart is easily accessible and can be downloaded for free by following the link on this page.
Cost-effective
Printable eye charts provide an easy and cost-effective way to perform vision screenings at home, at schools, or at community events. Free eye charts save costs for professionals and individuals by eliminating the need to purchase expensive standardized charts if they are unnecessary.
Easy to use
This chart includes straightforward instructions, making performing accurate eye tests simple. Its simple layout makes it a valuable for streamlining the eye screening process.
Portable
As they can be printed on standard A4-sized paper, the Printable Eye Chart is easy to transport and can be used in various settings, including at home, schools, or health events.
Commonly asked questions
To use the eye chart template, follow the steps outlined in this guide's "How does this Printable Eye Chart work?" section. The key steps involve printing the chart, positioning it correctly, testing each eye separately, recording the results, and interpreting the scores.
Interpret the eye chart results by comparing the test taker's visual acuity measurements to standard visual acuity levels. For example, 20/20 vision is considered "normal," while 20/40 vision indicates that the test taker can see at 20 feet what someone with normal vision can see at 40 feet. Results outside the normal range may warrant further evaluation by an eye care professional.
The eye chart is scored based on the smallest row of letters that the test taker can read accurately. This is expressed as a fraction, such as 20/20, 20/40, etc. The numerator represents the distance from the chart (20 feet), and the denominator represents the distance a person with "normal" vision could read the same line.