Blood Glucose Levels

Need a Blood Glucose Levels Chart? Easily track blood sugar with the user-friendly chart. Manage diabetes with precision.

By Olivia Sayson on Apr 08, 2024.

Fact Checked by Ericka Pingol.

Use Template

What Is A Blood Glucose Levels Chart?

A Blood Glucose Levels Chart, commonly known as a blood sugar chart, is a visual reference tool used to track and interpret blood glucose levels over time. It is a vital resource for individuals managing diabetes or monitoring their prediabetic status. The chart typically displays blood sugar measurements in milligrams per deciliter (mg/dL) on one axis and time or specific intervals (e.g., before and after meals) on the other axis.

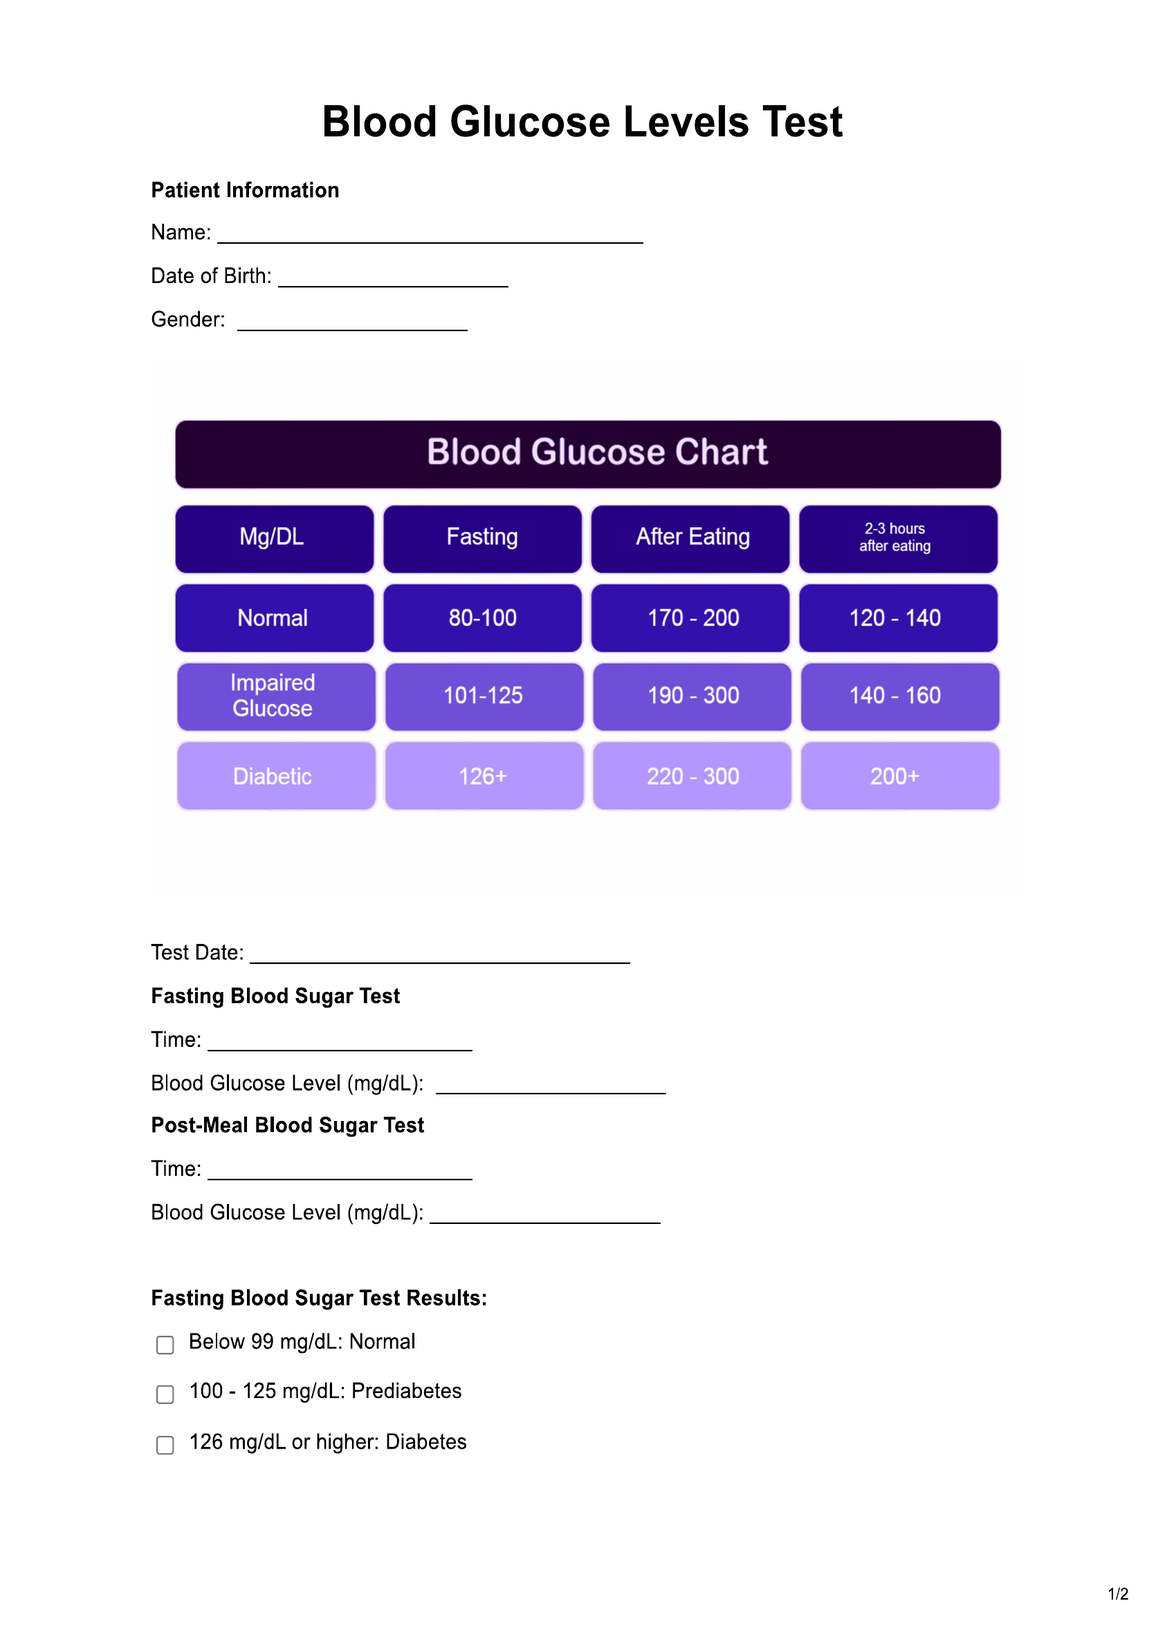
Typical Blood Glucose Levels Charts include target or normal range values, often indicating fasting and post-meal levels. These values help individuals assess their blood sugar levels within healthy boundaries. Deviations from these norms can signify prediabetes or diabetes.

This chart aids in identifying trends, making informed decisions about diet, medication, or lifestyle adjustments, and helps healthcare providers tailor treatment plans. It empowers individuals to actively manage their blood sugar and minimize the risks associated with diabetes-related complications. Regularly using a Blood Glucose Levels Chart is essential for maintaining stable glucose control and overall well-being.

Printable Blood Glucose Levels Chart

Download this Blood Glucose Levels Chart to track and interpret blood glucose levels.

How Does it Work?

Using the Printable Blood Glucose Levels Chart is straightforward. Here are five essential steps to ensure its accurate completion:

Step 1: Patient Information

Begin by entering the patient's personal details on the form, including their name, date of birth, and gender. This information is crucial for identification and record-keeping.

Step 2: Test Date and Times

Specify the date of the blood glucose test and record the exact times for both the fasting and post-meal blood sugar tests. Accurate timing is essential for interpretation.

Step 3: Blood Glucose Levels

For each test, input the corresponding blood glucose level in mg/dL. This data is the basis for evaluation and diagnosis, so precision is critical.

Step 4: Test Result Interpretation

Refer to the provided reference ranges to determine the patient's blood sugar status based on their test results. The firm offers clear categories, such as "Normal," "Prediabetes," or "Diabetes," to help with interpretation.

Step 5: Comments and Recommendations

If you're a healthcare provider, use the designated space to provide relevant comments or recommendations based on the test results. This is an opportunity to offer guidance and advice to the patient.

Blood Glucose Levels Chart Example (Sample)

The Blood Glucose Levels Chart Example, available as a PDF, provides a valuable tool for healthcare professionals. It visually represents a patient's blood glucose trends, enabling quick and informed assessment. Clear data on fasting and post-meal readings aids in diagnosing diabetes, prediabetes, or normal blood sugar levels. The chart streamlines data interpretation, making it easier to provide precise recommendations. 

For an enhanced patient care experience, download the Blood Glucose Levels Chart PDF and start efficiently monitoring and managing blood glucose levels today.

Download this Blood Glucose Levels Chart Example: 

When Would You Use This Chart?

The Blood Glucose Levels Chart is an indispensable resource for many healthcare practitioners. Primary care physicians and endocrinologists frequently rely on this tool during initial patient assessments to gauge blood sugar control and diagnose potential diabetes or prediabetes. 

It's a pivotal element for diabetologists in monitoring treatment effectiveness and making necessary adjustments. Certified diabetes educators can use the chart as an educational aid to explain blood glucose trends to patients, empowering them with knowledge for self-management. 

Additionally, nutritionists and dietitians find it valuable when crafting personalized dietary plans, as they can correlate food intake with blood sugar fluctuations. In emergency care settings, the chart helps quickly evaluate patients' blood glucose levels, aiding in prompt decisions on intervention. 

Thus, this resource finds utility across a spectrum of healthcare professionals, offering vital support in diagnosis, treatment, education, dietary guidance, and emergencies, ultimately enhancing patient care and well-being.

What do the Results Mean?

The Free Blood Glucose Levels Chart provides crucial insights into a patient's blood sugar status, with key implications for healthcare professionals. When fasting blood sugar levels fall below 99 mg/dL, this indicates normal blood glucose control, signifying no immediate cause for concern. The 100 to 125 mg/dL range suggests prediabetes, highlighting the need for lifestyle adjustments and closer monitoring. A fasting blood sugar level of 126 mg/dL or higher typically indicates diabetes, necessitating prompt medical attention.

In the post-meal blood sugar test, results below 140 mg/dL signify normal levels, while readings between 140 and 199 mg/dL generally indicate prediabetes. Results exceeding 200 mg/dL indicate diabetes, requiring immediate intervention to manage blood sugar effectively. 

These interpretations guide healthcare professionals in providing tailored care, lifestyle recommendations, and treatment strategies for their patients, thereby supporting better blood sugar management and overall health.

Why Use Carepatron As Your Blood Glucose Levels App?

Carepatron is your ultimate choice for managing blood glucose levels easily and efficiently. As a comprehensive and user-friendly Blood Glucose Levels Chart app, it offers a range of essential features to simplify your healthcare journey. 

With our Free Patient Record Software and Free Patient Portal Software, you can effortlessly keep track of your blood glucose readings, access your records securely, and share them with your healthcare team. It goes beyond the standard offerings, making your healthcare experience more convenient by integrating medical payment software, medical dictation software, and patient scheduling software into one platform. 

This all-in-one approach ensures that managing your blood glucose levels becomes a seamless part of your healthcare routine. Get the tools you need for efficient monitoring, easy communication, and streamlined administrative tasks, all in one place.

Clinical Documentation Software

References

  • International Diabetes Federation (2023). IDF Diabetes Atlas. 10th ed. Brussels: International Diabetes Federation.
Who typically requests a Blood Glucose Levels Chart?

Commonly asked questions

Who typically requests a Blood Glucose Levels Chart?

It is usually requested by healthcare providers, such as doctors, nurses, or endocrinologists, to monitor and assess a patient's blood sugar levels.

When are Blood Glucose Levels Charts used?

The charts are used during routine check-ups, diabetes management, and for patients with blood sugar concerns, helping healthcare professionals make informed decisions about treatment and lifestyle changes.

How are Blood Glucose Levels Charts used?

These are used to record fasting and post-meal blood sugar readings over time. Patients can fill in the chart with their test results, which healthcare providers interpret to make recommendations.

Join 10,000+ teams using Carepatron to be more productive

One app for all your healthcare work