What Is a Normal Glucose Levels Chart?

A normal glucose levels chart, also known as a blood sugar chart, is a visual representation that displays the range of blood glucose levels considered to be within a healthy or normal range for individuals. It is a valuable reference tool for people, healthcare professionals, and individuals with diabetes to monitor and understand blood sugar levels.

Typically, a standard glucose levels chart displays blood glucose values in milligrams per deciliter (mg/dL) or millimoles per liter (mmol/L) on the y-axis (vertical) and time or specific situations on the x-axis (horizontal). The chart may include various zones or ranges that help interpret blood sugar readings:

  • Hypoglycemia Range: This zone represents blood sugar levels lower than normal. It typically ranges from 70 mg/dL (3.9 mmol/L) or lower.
  • Normal Range: This is the target range that individuals aim to stay within. It usually falls between 70-130 mg/dL (3.9-7.2 mmol/L) for fasting blood sugar.
  • Prediabetes Range: Blood sugar levels in this zone are higher than normal, but not yet considered diabetic. For fasting blood sugar, it often falls between 100-125 mg/dL (5.6-6.9 mmol/L).
  • Diabetes Range: This zone indicates blood sugar levels that are consistently elevated and signify diabetes. Fasting blood sugar is typically 126 mg/dL (7.0 mmol/L) or higher.

The chart can be customized to include post-meal or post-prandial targets and other relevant details based on an individual's specific needs or the chart's context.

Glucose level charts are crucial for people with diabetes to track their blood sugar and make informed choices about treatment and lifestyle. They also assist healthcare professionals in diagnosing and managing diabetes and related conditions. Furthermore, these charts serve as educational tools, promoting awareness of the importance of maintaining healthy blood sugar levels to prevent diabetes-related complications.

Printable Normal Glucose Levels Chart

Download our free Normal Glucose Levels Chart PDF here

How Does It Work?

Access and Print

The journey begins with accessing a Printable Normal Glucose Levels Chart, which can be readily found online or provided by a healthcare professional. It's crucial to print the chart with precision to ensure clear and accurate readings.

Personalize

While optional, personalizing the chart by adding your name, date of birth, and other relevant information can help maintain organized records, making it easier to track your progress over time.

Understanding the Chart

Take a moment to understand the structure of the chart. Typically, it consists of a vertical axis displaying glucose levels in milligrams per deciliter (mg/dL) or millimoles per liter (mmol/L) and a horizontal axis indicating time or specific contexts (e.g., fasting, pre-meal, post-meal, bedtime).

Recording Blood Sugar Levels

With your blood glucose monitor, measure your blood sugar levels regularly. Accurately record these readings on the chart, placing them in the designated areas corresponding to the specified time or context.

Consistent Tracking

Consistency is key. Whether you track your blood sugar levels daily, weekly, or according to your healthcare provider's recommendations, regular monitoring ensures a continuous record of your progress.

Monitoring Trends

As you accumulate data on your chart, pay close attention to trends in your blood sugar levels. Look for high or low reading patterns, which can offer insights into how your body responds to different factors like medication, diet, and exercise.

Consulting Healthcare Professionals

Sharing your chart with your healthcare provider during check-ups is invaluable. They can analyze the data to make informed treatment adjustments, provide guidance, and assess the effectiveness of your diabetes management plan.

Normal Glucose Levels Chart Example (Sample)

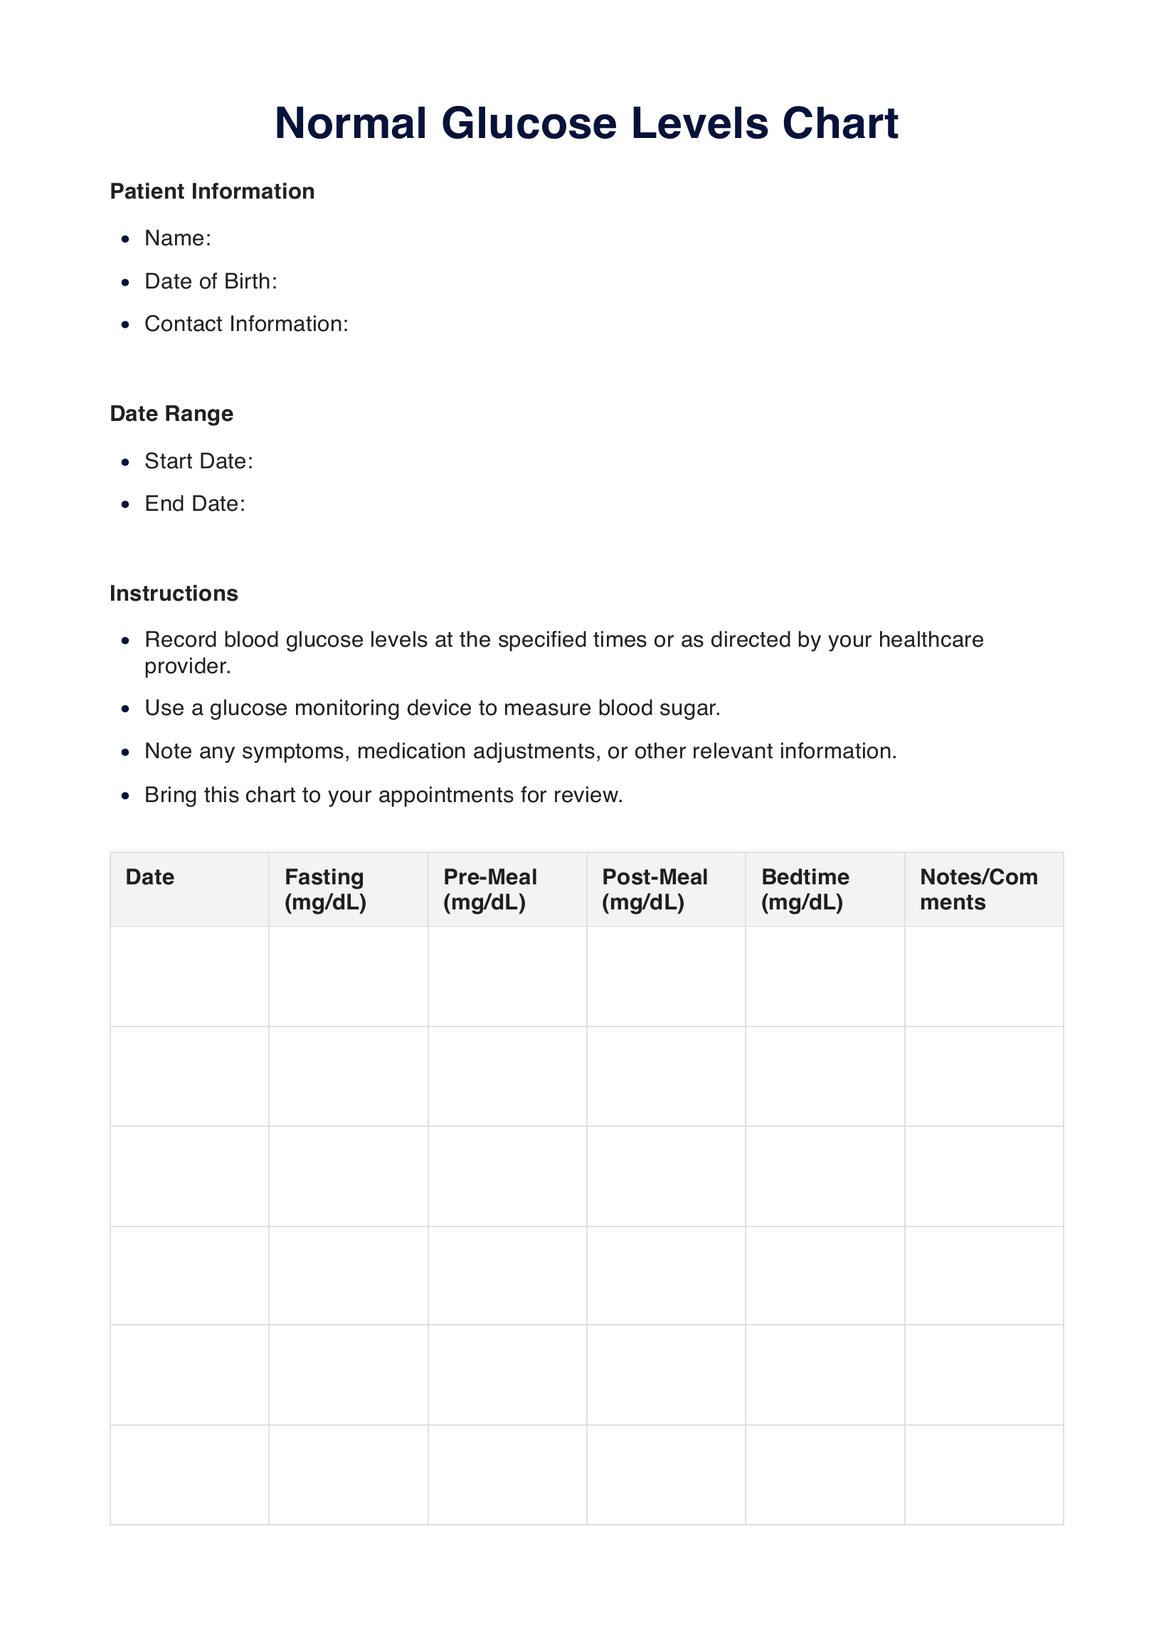
This is a sample of a Normal Glucose Levels Chart, a practical tool designed for individuals managing diabetes under healthcare professionals' guidance. This PDF chart includes essential patient information, such as name, date of birth, and contact details, creating a personalized record for tracking blood sugar levels. 

It outlines specific instructions for recording readings at designated times, ensuring accuracy and consistency in monitoring. The comprehensive chart allows users to document fasting, pre-meal, post-meal, and bedtime blood glucose levels, along with space for notes and comments to capture relevant information. 

It also features individualized blood sugar targets and recommendations provided by the healthcare provider, highlighting personalized care and treatment strategies. This Normal Glucose Levels Chart Example is a practical resource for tracking and managing blood sugar levels, helping individuals and healthcare professionals make informed decisions in diabetes management.

Check out our free Normal Glucose Levels Chart Example PDF here

Normal Glucose Levels Chart Example (Sample)

When Would You Use This Chart?

A Normal Glucose Levels Chart is a versatile resource with numerous applications for many practitioners and individuals. It is precious for:

  • Daily Monitoring: Those with diabetes can use this chart to track their blood sugar levels daily, helping them maintain better control and make informed choices about their diet, exercise, and medication.
  • Diagnosis and Assessment: Doctors, endocrinologists, and diabetes educators use these charts to diagnose diabetes or prediabetes. They also rely on them during regular check-ups to assess a patient's response to treatment.
  • Diet Planning: These professionals use the chart to understand how various foods affect a patient's blood sugar. It assists in creating tailored meal plans that help individuals manage their condition effectively.
  • Medication Management: Pharmacists can use the chart to educate patients on how medications impact their blood sugar levels, ensuring safe and effective use.
  • Physical Activity: For individuals with diabetes, a Normal Glucose Levels Chart can help instructors tailor exercise routines to help maintain stable blood sugar levels.
  • Data Collection: Researchers and clinical trial organizers use these charts to gather data on blood sugar fluctuations, helping to advance our understanding of 
  • Patient Education: Healthcare professionals utilize the chart to educate patients about the significance of monitoring their blood sugar levels and how to interpret the results.
  • Critical Situations: In emergency medical situations, such as diabetic emergencies, this chart can provide vital information about a patient's condition, guiding immediate treatment decisions.
Practice management software positive feedback

What do the Results Mean?

A Normal Glucose Levels Chart provides a valuable reference for interpreting blood sugar results. Understanding the common results and what they mean is crucial, especially for individuals with diabetes, healthcare professionals, and those at risk of developing the condition. Here are the typical results and their implications:

  • Normal Range (70-130 mg/dL or 3.9-7.2 mmol/L): Blood sugar levels within this range indicate healthy glucose regulation. It suggests that the body effectively manages blood sugar, with a lower risk of immediate complications.
  • Hypoglycemia (Below 70 mg/dL or 3.9 mmol/L): When blood sugar levels fall below 70 mg/dL, it signifies hypoglycemia or low blood sugar. Symptoms may include shakiness, dizziness, confusion, and, in severe cases, loss of consciousness. Immediate treatment with a source of fast-acting carbohydrates, like fruit juice or glucose tablets, is necessary.
  • Prediabetes (100-125 mg/dL or 5.6-6.9 mmol/L): Blood sugar levels in this range suggest prediabetes. It's a warning sign that the individual is at increased risk of developing type 2 diabetes. Lifestyle changes, such as a healthier diet and increased physical activity, are often recommended to prevent or delay the onset of diabetes.
  • Diabetes (126 mg/dL or 7.0 mmol/L and above): Fasting blood sugar levels consistently at or above 126 mg/dL indicate diabetes. It means the body cannot regulate blood sugar effectively, leading to various health risks. Diabetes management typically involves medication, dietary adjustments, and regular monitoring.
  • Post-Meal or Post-Prandial Values: Monitoring blood sugar levels after meals is crucial. An elevation of blood sugar levels (typically above 180 mg/dL or 10 mmol/L) two hours after eating may indicate poor post-meal glucose control, a concern for individuals with diabetes.

Why Use Carepatron as Your Normal Glucose Levels App?

Carepatron is the ultimate destination for managing your blood sugar levels with our cutting-edge Normal Glucose Levels Chart app and software. We offer an unparalleled, user-friendly experience designed for your health and well-being.

Our Normal Glucose Levels Chart app and software are designed with your needs in mind. Whether you're an individual managing your diabetes or a healthcare professional guiding patients, our platform is intuitive and user-friendly. Access and personalize your chart easily, ensuring a clear and organized record of your blood sugar levels.

We prioritize the accuracy and convenience of blood sugar monitoring. Our platform allows you to record your readings, analyze trends, and set personalized targets. Our platform is compatible with a range of glucose monitoring devices, making it easier to stay on top of your diabetes management.

At Carepatron, we empower you to take control of your health. With our Normal Glucose Levels Chart app, you can monitor your blood sugar levels in real-time, helping you make informed decisions about your diet, exercise, and medication. Our software facilitates seamless patient management and data analysis for healthcare professionals, enhancing the quality of care you provide.

Don't compromise when it comes to your health. Choose Carepatron as your partner in managing your blood sugar levels with our state-of-the-art Normal Glucose Levels Chart app and software. Your health and well-being are our top priority, and we are here to support you every step of the way.

Practice management software

References

Who typically requests a Normal Glucose Levels Chart?

Commonly asked questions

Who typically requests a Normal Glucose Levels Chart?

Individuals with diabetes, healthcare professionals, dietitians, and researchers often request Normal Glucose Levels Charts.
When are Normal Glucose Levels Charts used?

They are used for daily blood sugar monitoring, diabetes management, prediabetes assessment, meal planning, and research on blood sugar regulation.

How are Normal Glucose Level Charts used?

Users record blood sugar readings based on specified times or contexts on the chart. The chart helps track trends, assess treatment effectiveness, and make informed decisions.

How long does a Normal Glucose Levels Chart take?

Filling a Normal Glucose Levels Chart typically takes a few minutes each time you record a blood sugar reading, depending on how frequently you monitor your levels.

Join 10,000+ teams using Carepatron to be more productive

One app for all your healthcare work