What Is an Estrogen Levels Chart?

Estradiol, also known as 17-estradiol or simply estrogen, is the most common form of estrogen in females and has a wide range of essential roles in bone and muscle growth, the establishment of secondary sex characteristics, and stimulation of endometrial growth for the maintenance of pregnancy. 

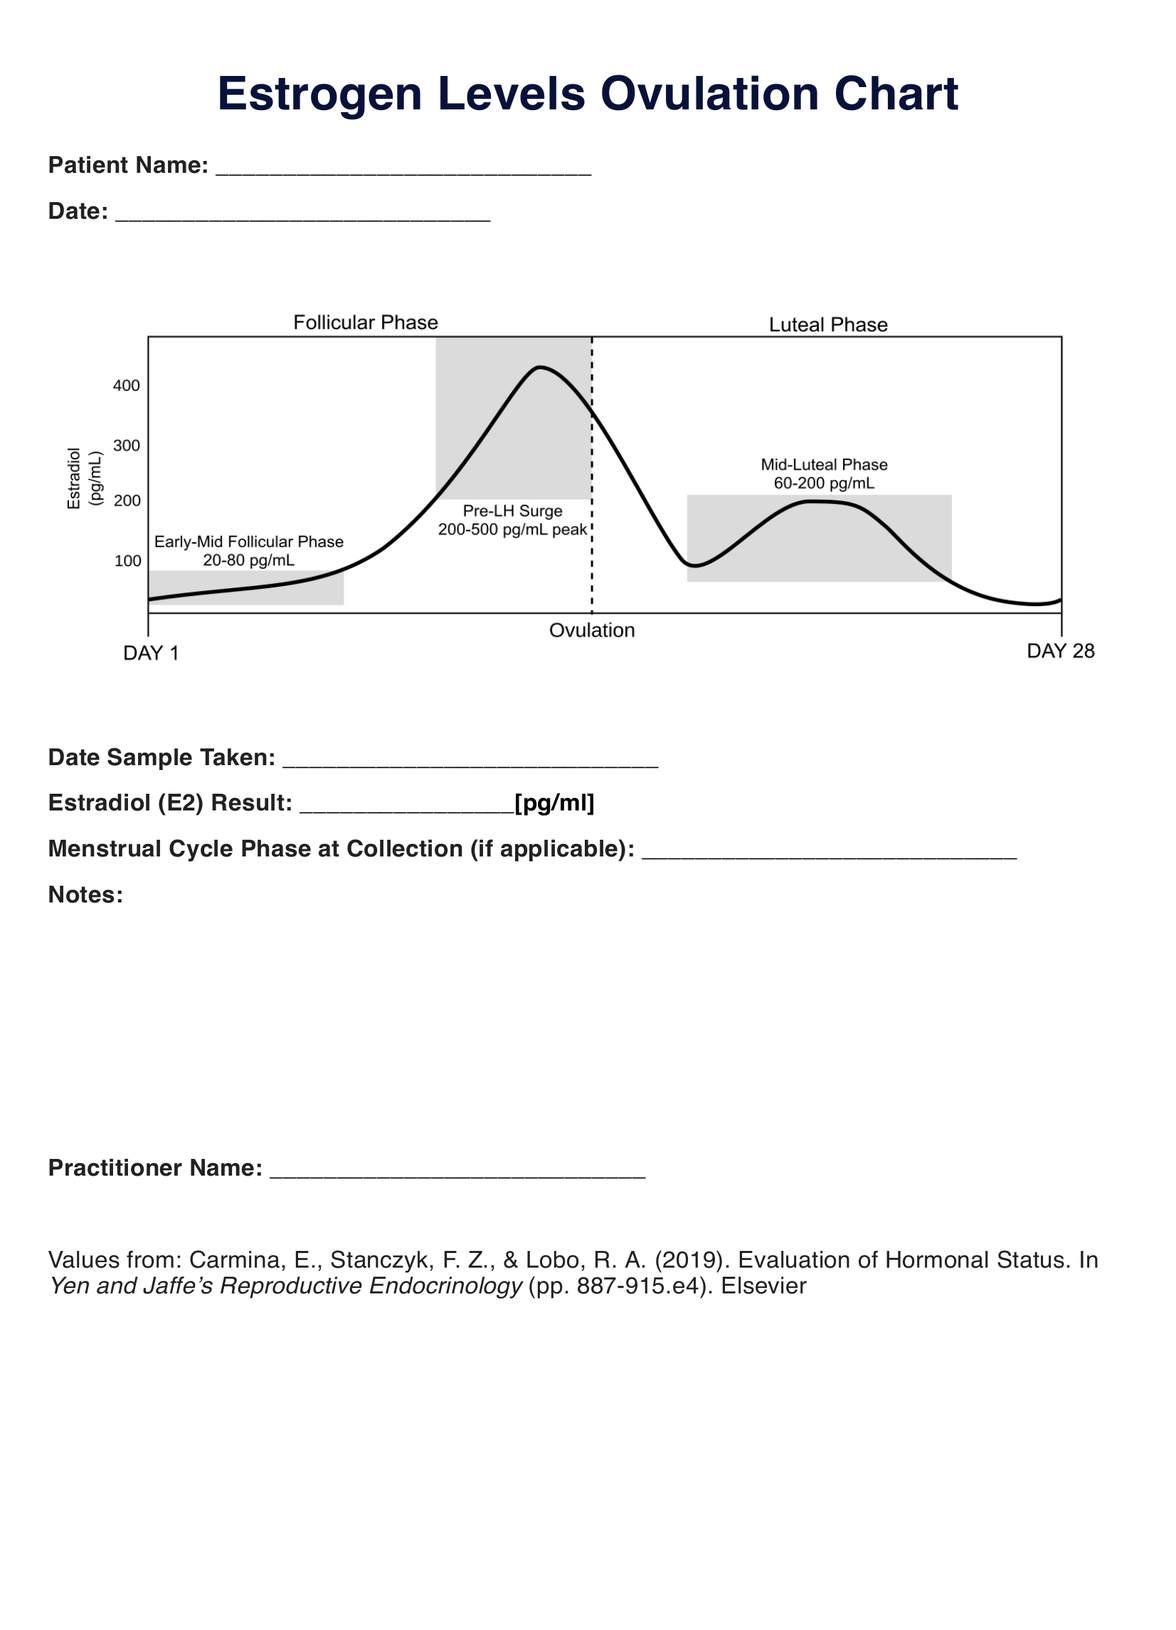
Estrogen levels naturally fluctuate through the course of the menstrual cycle, reaching a peak in the late follicular phase before descending following ovulation, rising again in the mid-luteal phase due to the formation of the corpus luteum, and eventually declining again if fertilization does not occur.

This pattern can be complicated to explain to patients but is essential for understanding an estrogen blood test result in context. As such, our Estrogen Levels Ovulation Chart is designed to provide a helpful visual resource alongside a numerical estrogen result. 

This helpful tool condenses estrogen level information into a single, easy-to-read chart. It's a fantastic educational resource, perfect as a supplement to your patient’s estrogen blood test results.

Downloadable Estrogen Levels Ovulation Chart

Check out our free Estrogen Levels Ovulation Chart PDF

How Does it Work?

  1. Fill in the Patient's Name and Date
  • Download the free PDF Estrogen Levels Chart from the link on this page and fill in the interactive spaces digitally, or print it out and complete it by hand.
  1. Enter the Patient’s Estrogen (E2) Result
  • Using the blood test results, input the E2, or estradiol, result in the designated space, careful that the units are in pg/mL.
  1. Add Menstrual Cycle Phase at Collection
  • If applicable, include the menstrual cycle phase during which the estrogen sample was taken. This can be worked out using the start date of your patient’s last period before the blood test and working forward with help from a resource such as our Menstrual Cycle Phases Chart. 
  1. Add any Additional Notes
  • Utilizing this information and the provided Estrogen Levels Chart, add your interpretation of the test result and any additional notes in the allocated space.

Estrogen Levels Chart Example (Sample)

You can explore how our Estrogen Levels Chart can provide important context to a seemingly high E2 result by downloading our sample Estrogen Levels Chart. 

You can download the example Estrogen Levels Chart here.

Download our free Estrogen Levels Chart PDF

Estrogen Levels Chart Example

When Would You Use This Chart?

There are a variety of situations where patients can benefit from having this supplementary resource provided. These include:

  • Providing Context for a Patient’s E2 Result: An E2 test reports blood estrogen concentration (pg/mL or pmol/L), but it can be confusing without context. Our Estrogen Levels Chart can supplement estrogen test results, offering clarity and understanding to your patients on the complicated patterns of estrogen over their cycles. 
  • Helping Patients Understand Their Cycles: The chart's primary graphic illustrates the cyclic nature of estrogen, showcasing normal changes throughout the menstrual cycle. This can aid patients in comprehending the dynamic nature of their hormone levels without needing to understand the mechanisms behind the changes in estrogen levels fully. 
  • Educating on Fertility, Contraception, or Menstruation: This resource can serve as an educational tool in teaching patients how fluctuations in estrogen levels contribute to critical events within the menstrual cycle, such as ovulation or menstruation. In turn, an understanding of the menstrual cycle can be built upon to educate on fertility, contraception methods, or menstruation disorders.

Research & Evidence

Ranges for estrogen levels at different phases of the menstrual cycle have been widely published, and techniques for measuring serum estrogen levels have been refined and improved since the first published values in the 1950s.

While the exact values can differ significantly between individuals, the relative estrogen changes throughout the menstrual cycle, such as the mid-cycle estrogen surge, have been consistently reported in journal articles from the 1970s (Korenman et al., 1974; Sherman & Korenman, 1975), 1980s (Hoff et al., 1984), 1990s (Fritz et al., 1992), 2000s (Burger et al., 2007) right up to present day endocrinology textbooks (Strauss & Barbieri, 2018; Taylor et al., 2020).

Therefore, the pattern of estrogen levels throughout the menstrual cycle is a well-researched topic with a wealth of evidence to support its various key features. 

The values presented in this Estrogen Levels Chart resource are taken from Yen & Jaffe’s Reproductive Endocrinology (Strauss & Barbieri, 2019) but are generally consistent with historically reported values. Within this textbook, Carmina et al. (2019) give the range of estradiol concentrations at the mid-cycle surge as 200-500 pg/mL, whereas Heitz et al. (1999) provide the peak values as 778 +/- 255.43 pg/mL and another earlier study gives the peak values as about 320-520 pg/mL (Korenman et al., 1974).

As such, it is clear that a wide range of values at each stage of the menstrual cycle can be considered normal, and it should be remembered that the values cited in these sources indicate the sample population of each study. Individuals may have measurements higher or lower than these ranges without anything pathological necessarily causing these differences.

Therefore, this resource attempts to present a stylized diagram of estrogen fluctuations throughout the menstrual cycle, indicating the possible ranges of values at each phase shown.

References

  • Burger, H. G., Hale, G. E., Robertson, D. M., & Dennerstein, L. (2007). A review of hormonal changes during the menopausal transition: Focus on Melbourne Women’s Midlife Health Project findings. Human Reproduction Update, 13(6), 559–565. https://doi.org/10.1093/humupd/dmm020
  • Carmina, E., Stanczyk, F. Z., & Lobo, R. A. (2019). Evaluation of Hormonal Status. In Yen and Jaffe’s Reproductive Endocrinology (pp. 887-915.e4). Elsevier. https://doi.org/10.1016/B978-0-323-47912-7.00034-2
  • Heitz, N. A., Eisenman, P. A., Beck, C. L., & Walker, J. A. (1999). Hormonal Changes Throughout the Menstrual Cycle and Increased Anterior Cruciate Ligament Laxity in Females. Journal of Athletic Training, 34(22), 14–149.
  • Korenman, S. G., Stevens, R. H., Carpenter, L. A., Robb, M., Niswender, G. D., & Sherman, B. M. (1974). ESTRADIOL RADIOIMMUNOASSAY WITHOUT CHROMATOGRAPHY: PROCEDURE, VALIDATION AND NORMAL VALUES. The Journal of Clinical Endocrinology & Metabolism, 38(4), 718–720. https://doi.org/10.1210/jcem-38-4-718
  • Sherman, B. M., & Korenman, S. G. (1975). Hormonal characteristics of the human menstrual cycle throughout reproductive life. Journal of Clinical Investigation, 55(4), 699–706. https://doi.org/10.1172/JCI107979
  • Strauss, J. F., & Barbieri, R. L. (Eds.). (2019). Yen & Jaffe's Reproductive Endocrinology: Physiology, Pathophysiology, and Clinical Management. Elsevier.
  • Taylor, H. S., Pal, L., & Seli, E. (2020). Speroff's Clinical Gynecologic Endocrinology and Infertility. Wolters Kluwer.
What Triggers Ovulation?

Commonly asked questions

What Triggers Ovulation?

As the dominant follicle develops, it secretes estrogen. The increasing but still estrogen levels provide negative feedback on LH and FSH. As estrogen is continually secreted in the late follicular phase, eventually, estrogen levels reach a high enough level that this feedback loop switches to positive, leading to a significant LH surge, which triggers ovulation.

Why Does Estrogen Rise Again in the Mid-Luteal Phase?

During the mid-luteal phase, estrogen levels rise again, though not as intensely as the initial spike. This rise is due to the formation of the corpus luteum, which secretes estrogen to maintain the endometrial lining for a potential pregnancy. If fertilization does not occur, estrogen and progesterone levels decline, triggering menstruation.

Is This Estrogen Levels Chart Representative of Everyone?

No. Menstrual cycles vary widely in length and regularity across individuals. The chart offers a stylized representation of estrogen changes over an average cycle and should not be considered the sole normal pattern. 

Join 10,000+ teams using Carepatron to be more productive

One app for all your healthcare work