What is a fishbone diagram?
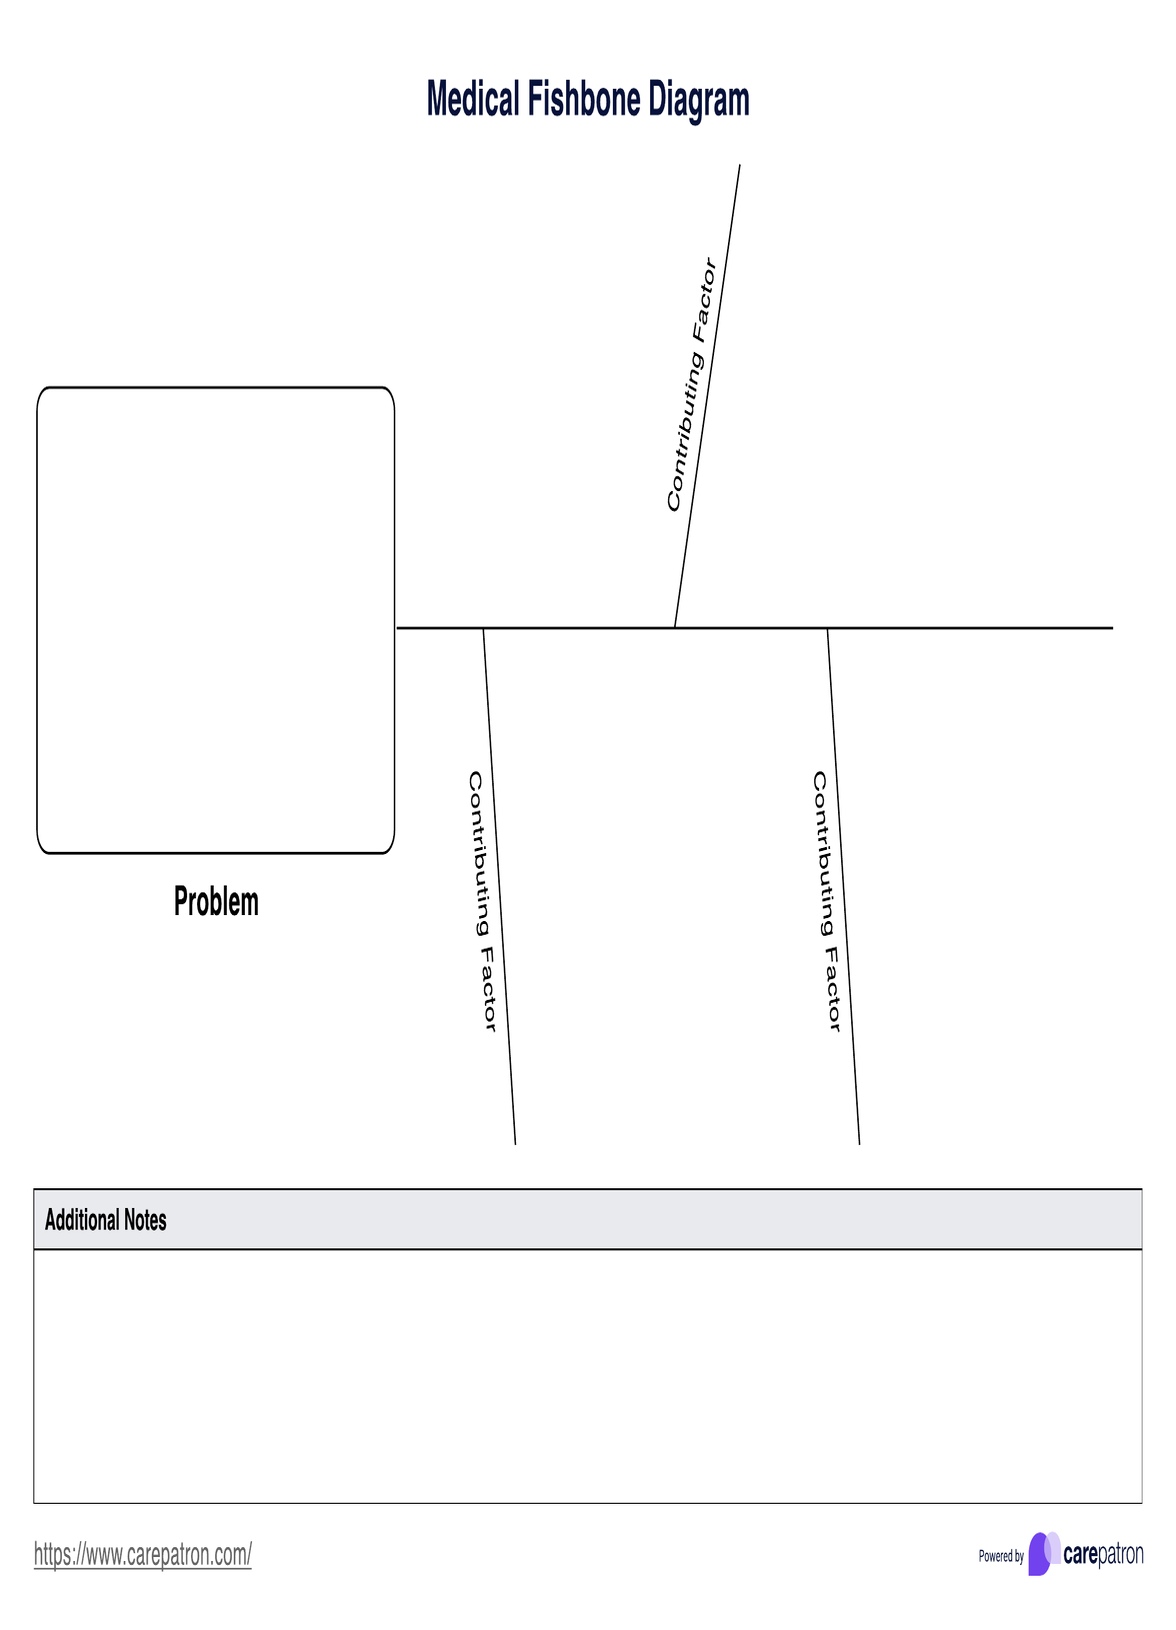
A Fishbone Diagram, also known as an Ishikawa diagram or a cause-and-effect diagram, is a visual tool used to systematically identify, sort, and display possible causes of a specific problem or effect. It helps to identify potential underlying issues by categorizing potential causes into major categories, which can vary depending on the context.
The diagram is called a "fishbone" because its shape resembles the skeleton of a fish, with a central "spine" and several branches representing different categories of root causes or contributing factors leading to the problem.
When is a fishbone diagram used?
Fishbone diagrams are ideal for situations where you have a complex problem and a lot of initial ideas about major cause of what might be causing it. Here are some specific times they come in handy:
- Brainstorming sessions: Fishbone diagrams help organize a team's initial thoughts on potential causes. Everyone can contribute ideas, which are then categorized logically for further discussion.
- Complex problems: For issues with many potential causes, a fishbone diagram helps you delve deeper into the root causes, not just surface-level solutions.
- Quality improvement projects: These diagrams help identify and document all the factors contributing to a problem, allowing for targeted interventions to improve quality.
- Before implementing solutions: Using a fishbone diagram ensures you've considered all possible causes before taking action. This helps you choose the most effective corrective steps.
By organizing and categorizing potential causes, fishbone diagrams promote a thorough analysis of problems. This leads to a deeper, better understanding of the root causes and, ultimately, more effective solutions.


