BBT Ovulation Chart

Use our free BBT Ovulation Chart in your practice. Download the free template and example in this guide.

By Alex King on Jul 15, 2024.

tick

Fact Checked by Nate Lacson.

Use Template
BBT Ovulation Chart PDF Example
ToolbarShare uiAI Icon

What is a BBT Ovulation Chart Template?

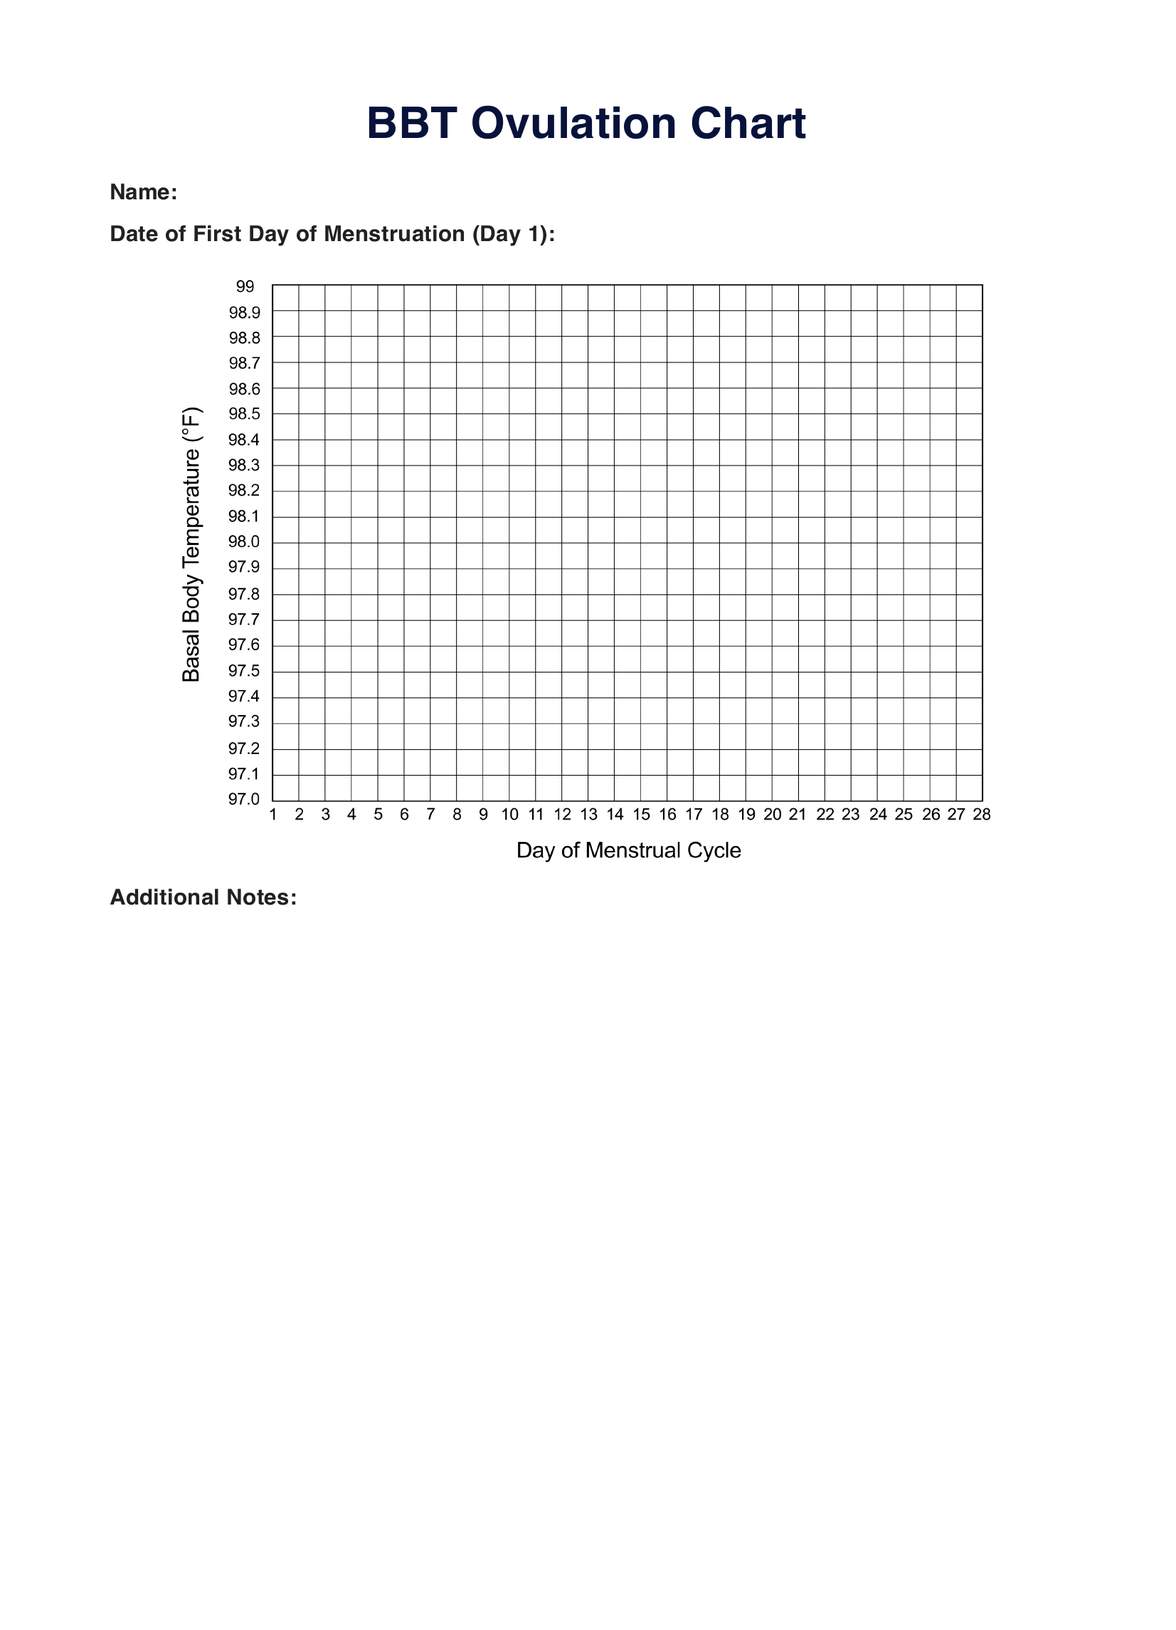
A BBT Ovulation Chart PDF is a tool that helps you track changes in your basal body temperature (BBT) over the course of your menstrual cycle. It's a handy way to monitor subtle temperature shifts, indicating when you're most likely to ovulate.

Simply put, your basal body temperature is your body's temperature at rest, and it tends to rise slightly after ovulation in the luteal phase due to hormonal changes. You can create a visual chart highlighting your fertility patterns by recording your daily temperature and other details like cervical mucus consistency and cycle days.

The BBT Ovulation Chart PDF provides a user-friendly format for documenting this information. It allows you to easily input and visualize your data clearly and organized. This can be particularly useful for individuals trying to conceive, as it helps identify the fertile window for optimal timing.

This chart also provides additional space for details such as cervical mucus changes, breakthrough bleeding, or additional comments.

How does it work?

This printable BBT Ovulation Chart Template will help make BBT tracking easier, but it still takes a little getting used to for those completely new to the method. Follow the simple steps below to build confidence in tracking your basal body temperature.

Step 1. Enter your BBT measurement daily

Measuring your BBT daily, preferably at the same time every day, is important. For best results, your BBT should be taken first thing in the morning using a digital thermometer before getting up and moving. 

Once you have a value for BBT, enter it into the chart for that day.

Step 2. Watch for nadir and temperature rise

The next step is to watch over the days for the dip in temperature before ovulation, known as the nadir, and the rise in temperature following ovulation. There are several methods for determining when the temperature rise has occurred, two of which are given below.

Coverline method

To use the coverline method you first need to collect 10 days worth of data prior to ovulation. Then, once BBT has risen at least 0.15 degrees Fahrenheit above these temperatures, the temperature rise has occurred.

Three over six method

Similarly to the coverline method, the three over six method defines the temperature rise as having occurred when three measurements are 0.28F above the highest point of the previous six temperatures, with at least one of the higher temperatures being 0.48F above the lower ones (Su et al., 2017).

Step 3. Use data to plan fertile windows

Once you have determined the nadir and temperature rise, and a better understanding of your cycle length, you can start planning around your fertile window. 

When would you use this template?

Whether you're actively planning a pregnancy or simply curious about your menstrual cycle, the PDF BBT Ovulation chart provides a visually accessible way to understand your body's unique patterns. This template is predominantly used by women looking to determine their fertile window to plan a pregnancy. 

Some may use this template to prevent pregnancy, but this is not recommended as the sole method of contraception due to the limitations of this method. While the BBT method is reasonably effective for tracking ovulation, it has limitations in preventing pregnancy and provides no defense against sexually transmitted infections. (Steward and Raja, 2023).

Research & evidence

The biphasic nature of basal body temperature throughout the menstrual cycle was first documented by Squire in 1868. Still, it wasn’t until the early 20th century that Theodoor van de Velde associated this temperature shift with ovulation.

Since then, further research has refined our understanding of the mechanism behind the basal temperature shift associated with ovulation, focusing on the capability of temperature monitoring as a contraceptive or family planning method (Marshall, 1968).

The cover line method developed by the World Health Organisation is a widely recommended method for estimating the time of ovulation. Still, Lang Dunlop et al. (2005) found that a “gap” method, utilizing a cohabiting partner’s measurements as a control, was more accurate. The “three over six” method developed by John Marshall in 1968 continues to be used in research and clinical settings (Su et al., 2017).

While BBT-based techniques for determining the time of ovulation are constantly being refined, and wearable technology such as wrist fitness trackers allow for greater precision, the BBT method remains imperfect (Shilaih et al., 2018). External factors such as fever, alcohol consumption, emotional stresses, or environmental factors can mask the true variations in basal body temperature due to ovulation. 

As such, the BBT method for tracking ovulation offers limited capability for preventing pregnancy and no capability for the prevention of sexually transmitted infections. Other contraceptive methods, such as barrier or hormonal contraceptives, should, therefore be used if looking to prevent conception (Steward and Raja, 2023).

References

Lang Dunlop, A., Schultz, R., & Frank, E. (2005). Interpretation of the BBT chart: Using the “Gap” technique compared to the Coverline technique. Contraception, 71(3), 188–192. https://doi.org/10.1016/j.contraception.2004.10.010

Marshall J. (1968) A field trial of the basal-body-temperature method of regulating births. Lancet. Jul 6;2(7558):8-10. doi: 10.1016/s0140-6736(68)92886-9. PMID: 4172715.

Mesen, T. B., & Young, S. L. (2015). Progesterone and the Luteal Phase. Obstetrics and Gynecology Clinics of North America, 42(1), 135–151. https://doi.org/10.1016/j.ogc.2014.10.003

Shilaih, M., Goodale, B. M., Falco, L., Kübler, F., De Clerck, V., & Leeners, B. (2018). Modern fertility awareness methods: Wrist wearables capture the changes in temperature associated with the menstrual cycle. Bioscience Reports, 38(6), BSR20171279. https://doi.org/10.1042/BSR20171279

Steward, K., & Raja, A. (2023). Physiology, Ovulation And Basal Body Temperature. In StatPearls. StatPearls Publishing. http://www.ncbi.nlm.nih.gov/books/NBK546686/

Su, H., Yi, Y., Wei, T., Chang, T., & Cheng, C. (2017). Detection of ovulation, a review of currently available methods. Bioengineering & Translational Medicine, 2(3), 238–246. https://doi.org/10.1002/btm2.10058

Can BBT tracking be used to prevent pregnancy?

Commonly asked questions

Can BBT tracking be used to prevent pregnancy?

No. Due to its susceptibility to external factors and the natural variations in menstrual cycles, BBT ovulation tracking should not be relied upon for preventing pregnancy. Other contraceptive methods, such as barrier or hormonal methods, should be used.
What factors can impact BBT?

BBT can be influenced by factors that raise or lower your body temperature. This could be emotional factors, an infection, your external environment, alcohol consumption, or other factors. 

How often does BBT need to be measured for this chart?

BBT needs to be measured daily for this chart to detect the nadir and rise in temperature associated with ovulation. 

Join 10,000+ teams using Carepatron to be more productive

One app for all your healthcare work