Healthcare professionals, such as doctors, nurses, and hematologists, typically request an Anemia Chart when assessing patients with suspected anemia.
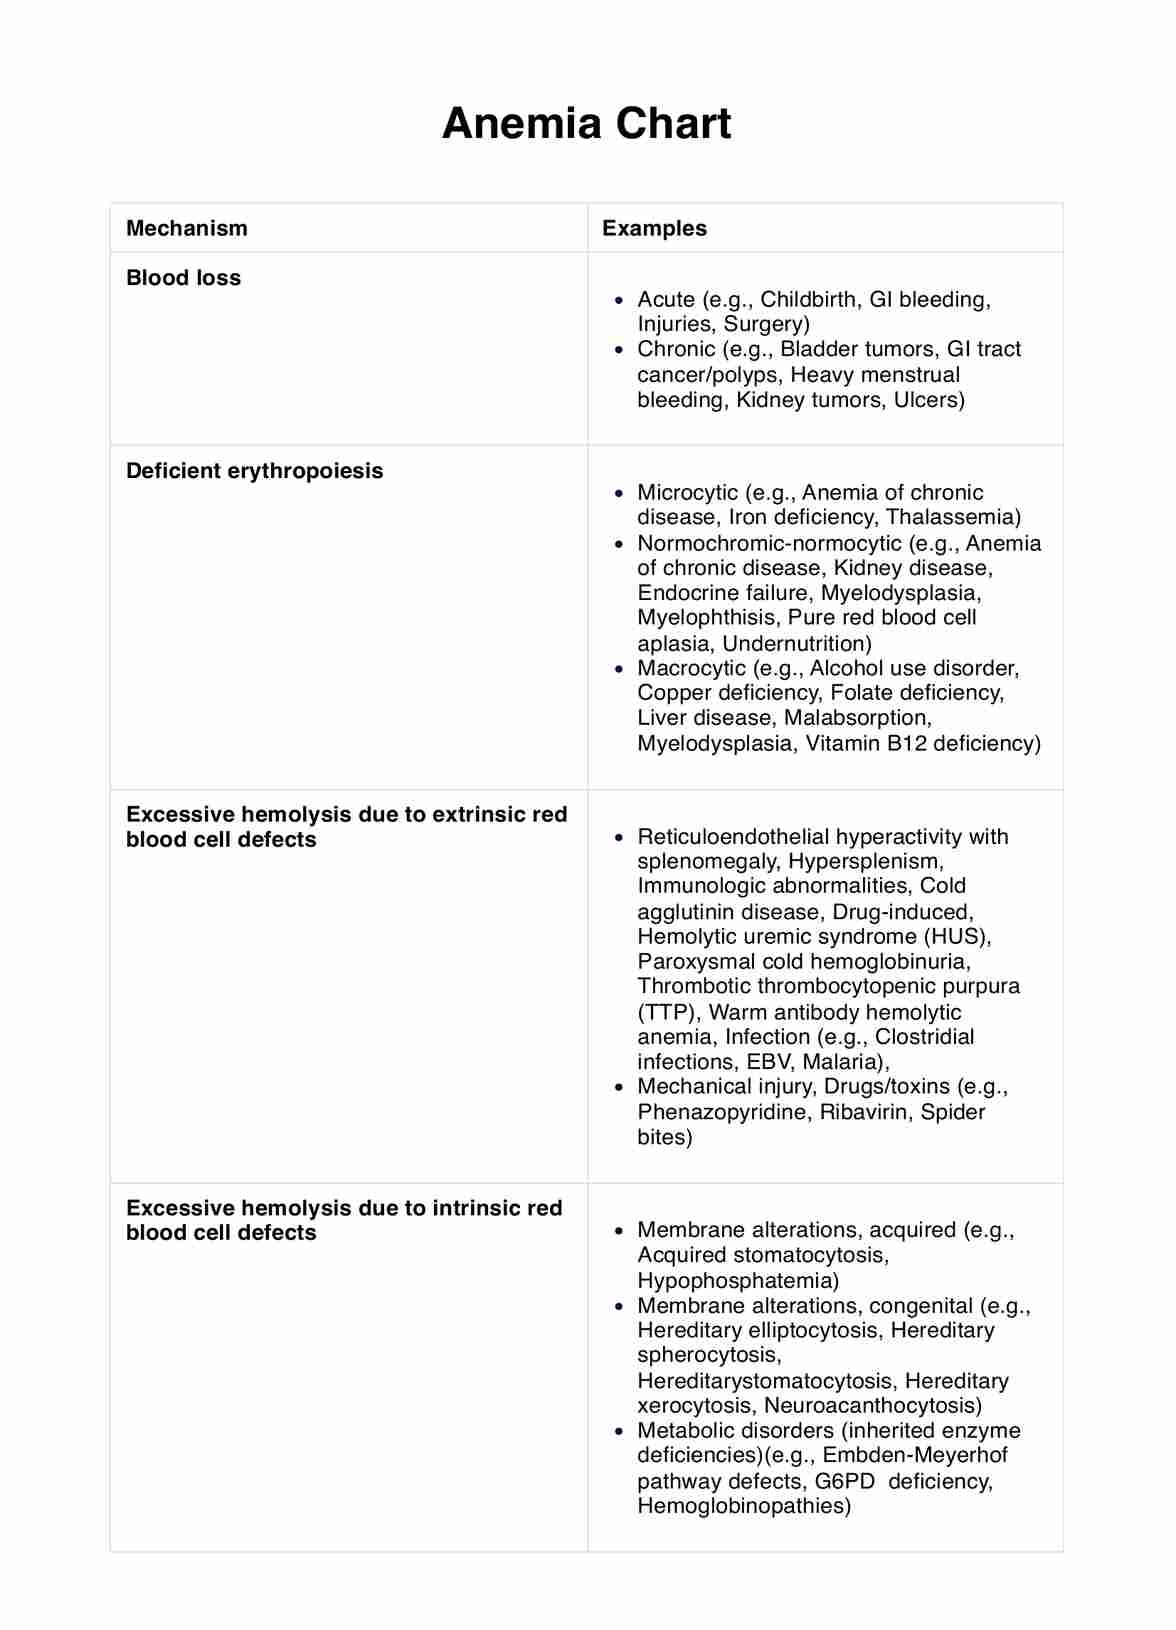
Anemia Chart
Diagnosing Anemia? Learn more about the Anemia Chart. Understand the cause and tailor treatment. Download now for precise anemia management.

Use Template
Anemia Chart Template
Commonly asked questions
Anemia Charts are used during patient assessments to classify and determine the underlying causes of anemia, guiding diagnosis and treatment decisions.
These charts are used by healthcare providers as a reference tool to categorize and manage anemia cases, assisting in tailoring treatment plans.


EHR and practice management software
Get started for free
*No credit card required
Free
$0/usd
Unlimited clients
Telehealth
1GB of storage
Client portal text
Automated billing and online payments