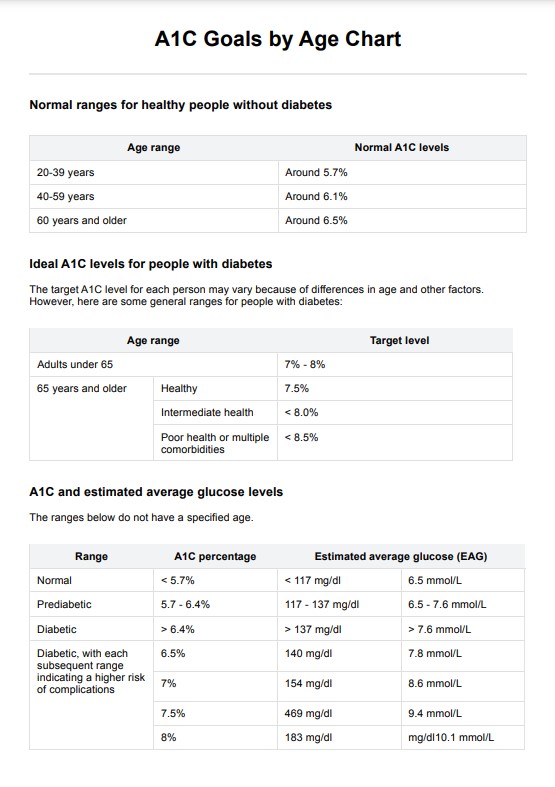
What is an HGB A1C Chart?

An HbA1c (Hemoglobin A1c) chart is a valuable medical tool used to monitor and manage blood glucose levels in individuals with diabetes. HbA1c is a form of hemoglobin that binds to glucose in the bloodstream. The chart is a graphical representation of the relationship between HbA1c levels and average blood glucose levels over a specific period, typically the past 2-3 months. This chart provides essential information for healthcare professionals and individuals with diabetes to assess and regulate their blood sugar control.

This resource typically ranges from 4% to 12%, with higher values indicating poorer blood sugar control. The American Diabetes Association (ADA) and other health organizations have established target HbA1c levels for individuals with diabetes based on age, health status, and other factors. These targets help set goals for maintaining healthy blood glucose levels and reducing the risk of diabetes-related complications.

The chart allows healthcare providers to track patients' long-term glucose management and adjust their treatment plans. For patients, it serves as a visual aid, helping them understand their progress and the importance of adhering to their treatment regimen. They can use it to evaluate their current HbA1c level, set personalized targets, and work with their healthcare team to make lifestyle changes, medication adjustments, or insulin-dosing alterations as needed.

This chart is a critical resource in diabetes management, promoting shared decision-making between healthcare professionals and patients and enhancing the overall quality of care. By regularly consulting the chart, individuals with diabetes can take proactive measures to achieve better glycemic control and reduce the risk of complications associated with the condition, such as cardiovascular disease, kidney problems, and nerve damage.

Printable HGB A1C Chart

Download this HGB A1C Chart to monitor and manage blood glucose levels in diabetic individuals.

How does it work?

Using an HbA1c (Hemoglobin A1c) chart is a straightforward process that involves monitoring and managing blood glucose levels for individuals with diabetes. Here's a step-by-step guide on how it works:

Step 1: Access a printable HbA1c chart

Obtain a printable HbA1c chart from a reliable source, such as your healthcare provider, diabetes clinic, or an online diabetes management website. These charts are typically available in PDF format for easy printing.

Step 2: Understanding the chart

Familiarize yourself with the HbA1c chart's layout and the numerical scale it uses. The chart usually ranges from 4% to 12%, with 4% representing excellent blood glucose control and 12% indicating poor control.

Step 3: Determine your current HbA1c level

Get your most recent HbA1c test result from your healthcare provider, which indicates your average blood glucose level over the past 2-3 months. This value will be represented on the chart.

Step 4: Set a target HbA1c level

Consult with your healthcare team to determine an appropriate target HbA1c level based on your health needs, age, and other factors. Your target should be within the recommended range.

Step 5: Use the chart

Locate your current HbA1c level on the chart and compare it to your target. This comparison will help you assess your blood sugar control.

Step 6: Adjust Your diabetes management plan

If your current HbA1c level is above your target, discuss potential modifications to your diabetes management plan with your healthcare provider. This may involve changes in medication, diet, exercise, or insulin dosing.

Step 7: Monitor progress

Regularly check your HbA1c levels, typically every 3-6 months, to track your progress. Update the chart with new values, and use it to guide ongoing adjustments to your diabetes management regimen.

HGB A1C Chart example (sample)

This sample HGB A1C Chart, available in PDF format, is a structured and invaluable tool for medical professionals in managing diabetes effectively. The template includes sections for patient information, HGB A1C results, interpretation, treatment plans, and follow-up recommendations. 

In a recent case involving a patient named John Doe, we observed a current HGB A1C level of 7.9%, slightly above the target range of 7.0%. The chart guided us in determining the necessary actions, such as medication adjustments, dietary recommendations, and exercise guidelines, to enhance blood glucose control. 

It also facilitates clear communication between healthcare providers and patients, promoting a collaborative approach to diabetes management. The sample HGB A1C Chart is an essential resource that streamlines the documentation and monitoring of diabetes care, helping healthcare professionals make informed decisions while guiding patients toward healthier outcomes.

Download this HGB A1C Chart Example:

When would you use this chart?

The HbA1c (Hemoglobin A1c) chart is a valuable resource used in diabetes management and is relevant for various practitioners, including healthcare providers, diabetes educators, and individuals with diabetes. Here are instances when this chart is appropriately utilized:

  • Routine Diabetes Monitoring: Healthcare providers use the HbA1c chart to assess the long-term blood glucose control of individuals with diabetes. It is a fundamental tool for tracking their patients' progress over time.
  • Diagnosis and Initial Assessment: In diagnosing diabetes or prediabetes, the chart can help establish a baseline HbA1c level. This baseline informs the initial assessment and treatment plan.
  • Setting Personalized Targets: Healthcare professionals work with their patients to determine individualized HbA1c target levels based on age, overall health, and comorbidities.
  • Treatment Adjustment: The chart is employed when a patient's HbA1c level exceeds their target. Healthcare providers use this information to adjust medication, insulin dosages, or lifestyle recommendations.
  • Monitoring Pregnant Women with Gestational Diabetes: For pregnant women with gestational diabetes, the HbA1c chart aids in tracking glucose control during pregnancy, helping to ensure the health of both the mother and the baby.
  • Diabetes Educators: Diabetes educators use the HbA1c chart to help individuals with diabetes understand the relationship between their daily glucose monitoring and long-term control, empowering them to make informed decisions about their health.
  • Patient Self-Management: Individuals with diabetes can use the chart to evaluate their progress in managing their condition. It motivates them to change their diet, exercise, and medication routines to achieve their target HbA1c levels.
  • Research and Clinical Studies: Researchers and scientists studying diabetes and related conditions use HbA1c charts to assess the efficacy of different treatment strategies, medications, and lifestyle interventions.

What do the results mean?

Interpreting the results of an HbA1c (Hemoglobin A1c) test is essential in understanding an individual's blood glucose control over the past 2-3 months. The HbA1c results are presented as a percentage, and each value signifies a specific level of glucose control. Here's a breakdown of common HbA1c results and their meanings:

  • 4% to 5.6% (20 to 38 mmol/mol): These levels are considered within the normal range for individuals without diabetes. If you fall within this range, it indicates excellent blood sugar control.
  • 5.7% to 6.4% (39 to 47 mmol/mol): Results in this range are often associated with prediabetes, which signifies an increased risk of developing diabetes. It's a crucial warning sign that suggests lifestyle changes and closer monitoring may be necessary to prevent the onset of diabetes.
  • 6.5% (48 mmol/mol) or higher: An HbA1c level of 6.5% or higher typically indicates the presence of diabetes. This result signifies poor blood sugar control and the need for immediate medical attention and management.
  • Individualized Target: The interpretation also depends on an individual's personalized target in consultation with healthcare providers. Achieving this target is a significant goal for individuals with diabetes, as it helps reduce the risk of complications.

It's important to note that the American Diabetes Association (ADA) and other healthcare organizations may recommend different target ranges based on individual factors, such as age, overall health, and comorbidities. Regular consultation with healthcare providers is crucial to establish and maintain an appropriate target.

Understanding HbA1c results is crucial in diabetes management. Maintaining target levels can prevent complications like heart disease, kidney problems, and nerve damage. Use a free HbA1c chart to monitor results over time for effective diabetes management.

Why use Carepatron as your HGB A1C app?

Are you searching for the ultimate HGB A1C Chart app to streamline your diabetes management journey? Look no further – Carepatron is the superior choice! With our cutting-edge HGB A1C Chart software, we offer the most comprehensive and user-friendly platform to empower you in your mission for optimal blood glucose control.

Our HGB A1C Chart app lets you track your HGB A1C levels over time. Say goodbye to the hassle of paper charts and manual calculations; our software provides a digital, intuitive, and convenient tool for managing diabetes. Easily input your data and witness your progress at a glance.

We take your diabetes management to the next level with personalized insights. Set your target HGB A1C level and receive guidance on achieving it. Our app is your dedicated partner, helping you make informed decisions, adjust your treatment plan, and reduce the risk of complications.

What sets us apart is our commitment to holistic diabetes care. We provide a platform for collaboration with healthcare providers and diabetes educators. Seamlessly share your HGB A1C data, receive expert guidance, and work together towards a healthier future.

Don't compromise when it comes to your diabetes management. Join the Carepatron community and experience the convenience, personalized support, and data-driven insights that make us the top choice for HGB A1C Chart management. Your journey to better health starts here.

Clinical Documentation Software

References

Charleson, K. (2023, August 10). What do high A1C levels mean? Verywell Health. https://www.verywellhealth.com/what-happens-when-a1c-is-too-high-5118384 

Dierks, M. H. (2020, April 30). A1C: What it Measures, Conversion Calculator, Ranges & Tips. AgaMatrix. https://agamatrix.com/blog/a1c-calculator/ 

Emma W. (n.d.). What is HbA1c? Diabetes UK. https://www.diabetes.org.uk/guide-to-diabetes/managing-your-diabetes/hba1c 

GmbH, D. D. S. (n.d.). HBA1C calculator. HbA1c. https://www.hba1cnet.com/hba1c-calculator/ 

Horowitz, G. L., MD. (n.d.). Hemoglobin A1C testing: reference interval, interpretation, background. https://emedicine.medscape.com/article/2049478-overview?form=fpf 

Linjawi, S. (2020, July 29). HBA1C | Haemoglobin A1C | Calculator. My Health Explained. https://www.myhealthexplained.com/diabetes-information/diabetes-tools/hba1c-tool 

Manfred, E. (2023, May 19). Understanding A1C: levels, normal range, and more. Healthline. https://www.healthline.com/health/type-2-diabetes/a1c-test 

Patra, S. K., & Patra, S. K. (2023, October 15). HBA1C Test Chart (Hemoglobin A1C): Check HBA1C normal range, levels, meaning & full form. Breathe Well-Being. https://www.breathewellbeing.in/blog/hba1c-a1c-chart-test-levels-normal-range/ 

Seery, C. (2023, October 2). Guide to HBA1C. Diabetes. https://www.diabetes.co.uk/what-is-hba1c.html#google_vignette 

Who typically requests an HGB A1C Chart?

Commonly asked questions

Who typically requests an HGB A1C Chart?

Healthcare providers, such as doctors and endocrinologists, often request HGB A1C Charts for their patients with diabetes.

When are HGB A1C Charts used?

HGB A1C Charts assess long-term blood glucose control in individuals with diabetes. They are typically employed for routine monitoring, diagnosis, treatment adjustments, and goal setting.

How are HGB A1C Charts used?

HGB A1C Charts are used by entering the patient's HGB A1C test results to track and visualize their blood glucose control. This information helps healthcare providers and patients make informed decisions about diabetes management.

Join 10,000+ teams using Carepatron to be more productive

One app for all your healthcare work