Triphasic BBT Chart

Discover how a Triphasic BBT Chart can help track fertility and early pregnancy signs. Download our free PDF for insights and examples.

By Russell Tan on Apr 21, 2024.

Fact Checked by Ericka Pingol.

Use Template

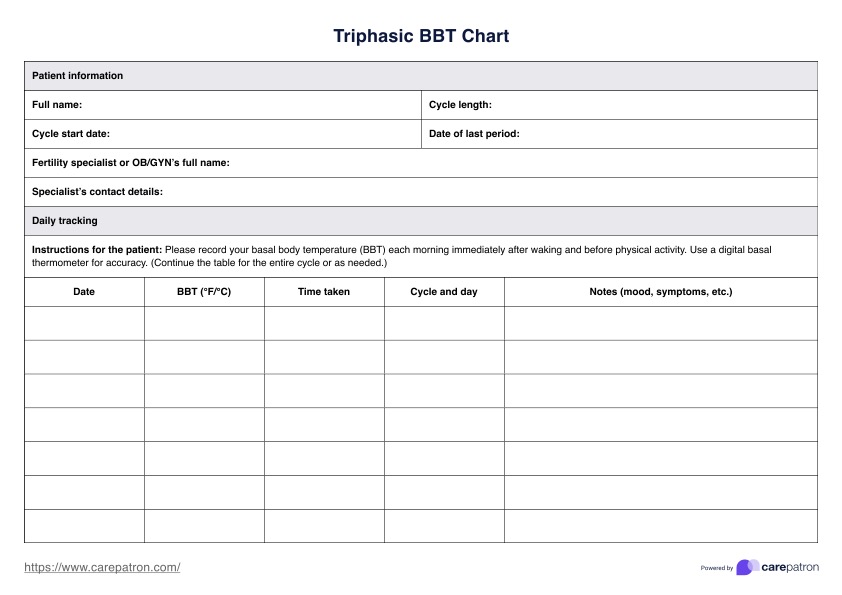
What is a Triphasic Basal Body Temperature Chart?

A Triphasic Basal Body Temperature (BBT) chart tracks changes in body temperature and can help a woman understand her fertility cycle. It is called "triphasic" because it shows three distinct temperature shifts over the course of a menstrual cycle, as opposed to three distinct temperature phases in the more common "biphasic" pattern.

How is a Triphasic Chart different from a Biphasic BBT Chart?

The distinction between a triphasic and a biphasic basal body temperature chart lies in the detailed temperature shifts observed throughout distinct temperature phases of the menstrual cycle. While both charts are invaluable tools for tracking fertility, the triphasic chart goes further by indicating a potential third phase.

This unique aspect of the triphasic chart offers deeper insights, particularly in the context of early pregnancy detection. By comparing these two types of pregnancy charts, one can better understand the intricacies of the menstrual cycle and its impact on body temperature.

What are the three levels of body temperature it measures?

Understanding the nuanced body temperature levels measured by a triphasic chart is key to interpreting its implications for fertility and overall reproductive health. Each phase represented in the chart offers valuable insights into the hormonal ballet that orchestrates the menstrual cycle.

  1. Pre-ovulation phase (follicular phase): This is before ovulation occurs. Temperatures during this phase are generally lower and more stable. This phase ends with the onset of ovulation.
  2. Post-ovulation phase (luteal phase): Following ovulation, the release of progesterone causes body temperature to rise and remain elevated. This is the body's way of creating a conducive environment for a fertilized egg to implant and grow.
  3. Possible implantation phase: If a triphasic pattern emerges, the third phase is marked by another slight increase in temperature, potentially indicating early pregnancy. This phase is not always present, even in cycles that result in pregnancy, and not all triphasic temperature patterns mean a woman is pregnant.

Printable Triphasic BBT Chart

Download this Triphasic BBT Chart to monitor menstrual cycle changes and aid in fertility assessment, guiding personalized reproductive health interventions for healthcare professionals.

How does our Triphasic BBT Chart template work?

Our Triphasic BBT Chart template provides a detailed and structured framework for tracking basal body temperature variations across different phases of a woman's menstrual cycle, helping to identify ovulation patterns and potential early signs of pregnancy. Here's how to use our template:

Step 1: Download the template

Start by downloading a copy of our Triphasic BBT Chart template from our website. The template is free and can be in various formats to suit your preference for digital tracking or a physical copy. Ensure you have the software to open and edit the template if you use it digitally.

Step 2: Customize according to your cycle

Adapt the template to your menstrual cycle's length and characteristics. The template includes spaces to enter daily temperature readings, along with sections for noting the phases of your cycle: pre-ovulation (follicular phase), post-ovulation (luteal phase), and, if observed, the secondary rise indicative of a triphasic pattern. You can also customize it to include notes on symptoms, mood, or other factors like sleep quality and illness, which might affect your temperature readings.

Step 3: Record your daily temperature

Use the template to log your basal body temperature every morning. For accuracy, take your temperature at the same time each day before getting out of bed or engaging in any activity. Record your temperature in the template alongside any relevant notes that could influence your readings.

Step 4: Monitor your cycle and identify patterns

As you fill in your daily temperatures, watch for the characteristic shifts that indicate the different phases of your cycle. A biphasic pattern signifies ovulation, while a triphasic pattern could suggest early pregnancy. Use the template to track these patterns over several cycles to understand your menstrual health and fertility better.

Step 5: Use the data for health planning

The information gathered in your Triphasic BBT Chart can be invaluable for family planning, understanding fertility, and discussing your reproductive health with healthcare providers. The chart can help you identify your most fertile days if you are trying to conceive. If you notice a triphasic pattern and suspect pregnancy, this tool can prompt you to take a pregnancy test or consult a healthcare professional for further advice.

Triphasic BBT Chart example

Our Triphasic BBT Chart template is tailored for individuals and healthcare professionals focused on tracking fertility and early signs of pregnancy. It provides a structured approach to recording daily basal body temperatures, capturing the distinct phases of temperature shift the menstrual cycle: pre-ovulation, post-ovulation, and the possible secondary rise indicative of a triphasic pattern. This detailed format includes sections for temperature entries, cycle days, and notes on physical or emotional changes, allowing for precise ovulation and early pregnancy indicators monitoring.

Download our free Triphasic BBT Chart example here:

Triphasic BBT Chart example

When is this chart used by healthcare professionals?

Healthcare professionals might use a triphasic basal body temperature (BBT) chart in various contexts related to women's reproductive health, primarily to understand a woman's menstrual cycle and fertility status. Here are some specific situations when this chart could be used:

  1. Fertility assessment: When a couple tries to conceive, healthcare professionals might use BBT charting as part of a fertility assessment. The chart can help determine if and when ovulation is occurring, which is crucial for timing intercourse for conception.
  2. Evaluating menstrual health: BBT charts can provide insights into a woman's menstrual cycle regularity and health. Irregular or absent temperature shifts may suggest issues like anovulation (no ovulation) or other hormonal imbalances that could affect fertility.
  3. Early pregnancy indication: Although not a definitive method for confirming pregnancy, a triphasic temperature pattern might prompt healthcare providers to suggest further pregnancy testing. This can be particularly useful for women actively trying to conceive and tracking their cycles closely.
  4. Monitoring reproductive health treatments: For patients undergoing fertility treatments or interventions to regulate their menstrual cycles, BBT charting can offer valuable feedback on the effectiveness of these treatments. Healthcare professionals can use the information to make adjustments to treatment plans.
  5. Educational tool: Healthcare providers may use BBT charting to teach women about their reproductive cycles. Understanding how to chart BBT can empower women to be more in tune with their bodies and recognize patterns that may indicate fertility or health issues.

What are the benefits of using this chart?

Using a triphasic basal body temperature (BBT) chart offers several benefits, particularly for women monitoring their reproductive health or trying to conceive. Here are some of the key advantages:

  1. Understanding ovulation patterns: A triphasic BBT chart can help a woman identify her ovulation patterns, providing insights into the most fertile days of her cycle. This knowledge can be crucial for couples trying to conceive.
  2. Early indication of pregnancy: While not a definitive method of confirming pregnancy, a triphasic pattern on a BBT chart may be an early indicator of pregnancy. This can be particularly useful for those actively trying to conceive and eager for early signs.
  3. Cost-effective fertility tracking: BBT charting is a cost-effective method for tracking fertility. It requires only a basal thermometer and a way to chart the temperatures, making it accessible to many women without the need for expensive technology or tests.
  4. Empowering self-awareness: Learning to chart BBT and interpret the patterns can empower women with greater awareness and understanding of their menstrual cycles and reproductive health. This self-knowledge can be valuable in discussions with healthcare providers and in making informed health decisions.
  5. Non-invasive monitoring: BBT charting is a non-invasive way to monitor fertility and menstrual health. It doesn't involve any medical procedures, making it an appealing option for those who prefer to avoid more invasive fertility testing methods.
  6. Identifying potential fertility issues: Regular BBT charting can help identify patterns that may suggest fertility issues, such as anovulation (the absence of ovulation) or luteal phase defects. Early identification of such issues can lead to timely consultation with healthcare providers.
  7. Complement to other fertility tracking methods: BBT charting can be used in conjunction with other fertility tracking methods, such as monitoring cervical mucus or using ovulation predictor kits, to provide a comprehensive view of a woman's fertility.
Can stress or illness affect my BBT chart?

Commonly asked questions

Can stress or illness affect my BBT chart?

Yes, stress, illness, lack of sleep, and other factors can affect your BBT readings, potentially making it more challenging to interpret your chart accurately. It's important to note any such factors when charting your BBT.

How accurate is BBT charting for detecting ovulation?

BBT charting can effectively detect ovulation after it has occurred, as the rise in temperature indicates the presence of the hormone progesterone, which spikes after ovulation. However, it does not predict ovulation in advance.

How long should I chart my BBT to see a triphasic pattern?

It varies, but charting for a few cycles can give you a clearer picture of your menstrual cycle's pattern. A triphasic pattern would only emerge in cycles where such a pattern occurs, typically indicating potential early pregnancy or hormonal fluctuations.

Join 10,000+ teams using Carepatron to be more productive

One app for all your healthcare work