


What is an ECG Diagram?
An is a visual representation that provides information on how well the heart is functioning and how often/regularly the patient’s heart beats. One can see these pieces of information in the form of waves and waveforms.
What an ECG diagram contains varies depending on the creator of the resource. However, one can expect essential details and visuals involving reading an ECG to be standardized across resources.
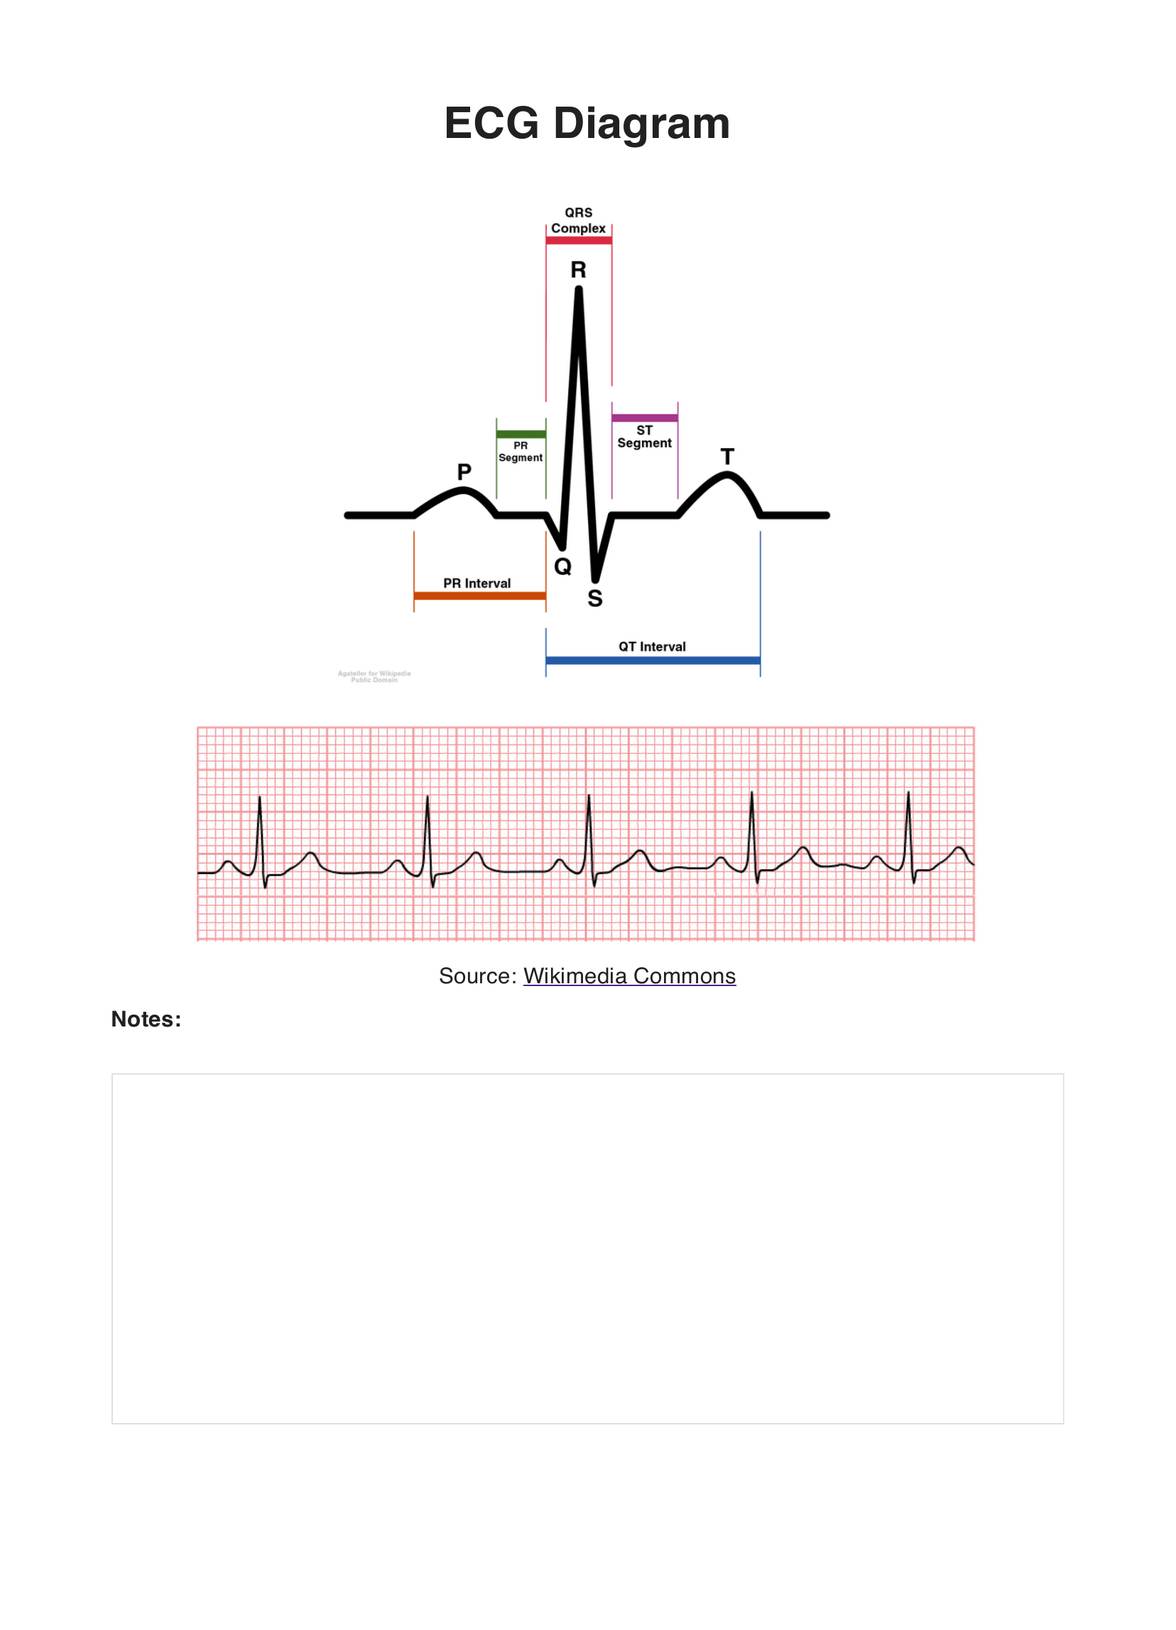
Our ECG diagram template uses the standardized visuals of the PQRST wave, a sample of an ECG of a patient with a normal sinus rhythm, and a dedicated space for any notes you may have. You may use this template as a basis for comparison or a document for any observations/findings on a patient.
For a copy you can use in your practice, proceed to the next section for instructions on downloading and using the template.


