Pediatric BMI Chart

Download our Pediatric BMI Chart for a resource that can assist you in assessing and documenting a child's weight status.

By Olivia Sayson on Apr 21, 2024.

Fact Checked by Nate Lacson.

Use Template

What is body mass index?

Body mass index (BMI) measures a person's weight based on their height to estimate body fat and determine whether their weight is healthy. For adults, a healthy BMI range is between 18.5 and 24.9, with underweight being below 18.5, overweight between 25 and 29.9, and obese at 30 or above. In children and teens aged 2 to 18, BMI is calculated based on age and gender, expressed as a percentile relative to peers.

Although BMI is a helpful screening tool, it is not a perfect measure of body fat, as muscle mass, age, sex, and ethnicity can affect its accuracy. Healthcare providers use BMI along with other assessments to evaluate health risks, and a high BMI may suggest excess body fat, potentially leading to issues like heart disease, stroke, and type 2 diabetes.

BMI is a quick, easy method for estimating body fat, but it should be part of a broader health evaluation.

Printable Pediatric BMI Chart

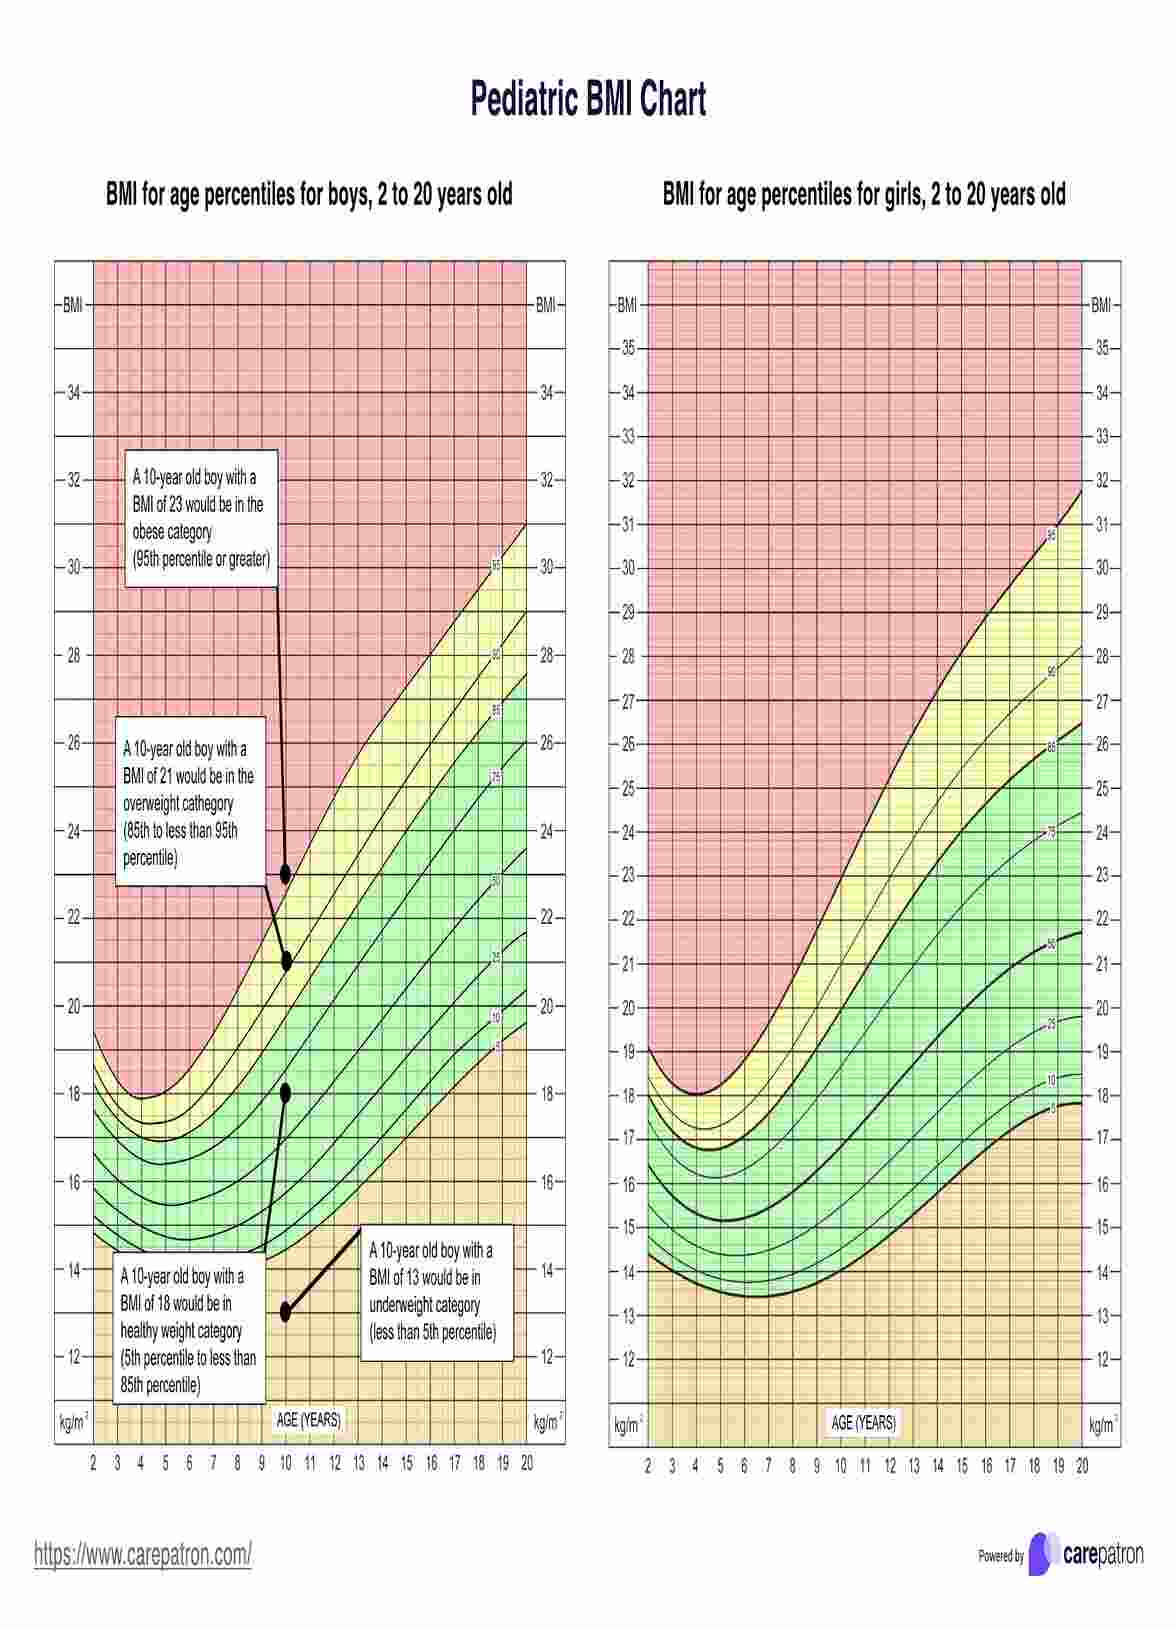
Download this Pediatric BMI Chart to track children's growth and assess nutritional status, aiding in early detection of potential health risks for healthcare professionals.

How is a pediatric BMI different from adult BMI?

Pediatric BMI differs from adult BMI by accounting for age and gender, expressed as percentiles relative to peers of the same age and sex. Children's bodies change as they grow, affecting body fat levels and development rates. Pediatric BMI is plotted on age- and sex-specific charts, while adults use fixed BMI ranges.

For children, weight status categories are based on percentiles, such as overweight (85th to <95th percentile) and obesity (≥95th percentile), whereas adults use fixed BMI values (e.g., overweight 25.0-29.9 kg/m^2, obesity ≥30 kg/m^2).

The transition from pediatric to adult BMI typically occurs around age 20, shifting from age- and sex-specific percentiles to fixed BMI categories.

What is a healthy BMI for children?

Weight status categories for children and teens include:

  • Underweight: Less than the 5th percentile
  • Normal weight: 5th percentile to less than the 85th percentile
  • Overweight: 85th to less than the 95th percentile
  • Obesity: Equal to or greater than the 95th percentile

These vary by age, so it is important to consider that when looking at a child's BMI percentile.

What is a Pediatric BMI Chart?

A pediatric BMI chart is a resource that assists practitioners during physical evaluations in documenting and assessing a child's weight status based on their body mass index (BMI), age, and sex.

BMI for children and teens is calculated using the same formula as for adults (weight in kg divided by height in m squared), but its interpretation differs for younger age groups. Children's and teens' BMI levels are expressed as percentiles relative to others of the same age and sex, using CDC growth charts based on national survey data. A child's BMI percentile indicates how their BMI compares to that of peers; for example, a BMI in the 60th percentile means that 60% of children of the same gender and age have a lower BMI.

Pediatric BMI charts are valuable for monitoring a child's growth pattern over time and should be taken at least once a year, starting at age 2. Although BMI is a helpful screening tool, it is not a definitive measure of body fat, and further assessments may be necessary to evaluate whether a child's weight poses a health risk. These charts help healthcare providers to document and identify children at risk of weight-related health problems, facilitating early intervention and promoting healthy growth and development.

How does our Pediatric BMI Chart template work?

Our chart can help in the documentation and assessment process during physical evaluations. Here is a quick guide on how to use our Pediatric BMI Chart effectively:

Measure the child's height and weight

Begin by measuring the child's height in inches using a stadiometer and weight in pounds using a scale. Record the measurements accurately.

Locate the child's height and weight on the chart

Find the child's height in inches on the left column and their weight in pounds across the top row.

Determine the child's BMI

Trace the child's weight column down and height row across until they intersect. The value at this intersection is the child's BMI.

Interpret the child's BMI

Compare the child's BMI value to the color-coded categories at the bottom of the chart to determine their weight status. This will indicate if the child is underweight, normal weight, overweight, or obese.

Pediatric BMI Chart example

We have developed a Pediatric BMI Chart PDF Example to help you understand how to use this free template effectively. This sample demonstrates how to record your findings after assessing a hypothetical child's BMI about their age and sex. You can view the sample here or download it as a PDF.

Download our free Pediatric BMI Chart template example here

Pediatric BMI Chart example

Why use Carepatron as your general practice and documentation software?

Carepatron is the ideal solution for streamlining your general practice and clinical documentation needs. Our software provides a comprehensive suite of tools to simplify your practice management, helping you save time and enhance efficiency. Carepatron's intuitive interface makes navigating patient records easy, securely storing documents, and managing all aspects of your practice.

With advanced analytics and real-time reporting, Carepatron empowers you to make data-driven decisions quickly and efficiently. Our secure connectivity and automated workflows facilitate seamless communication between providers, staff, and patients, improving collaboration and patient care.

Carepatron prioritizes your data's safety with high-level encryption, backup systems, and multiple redundant servers to ensure secure data storage. By leveraging our platform, you can focus more on patient care and less on administrative tasks.

Join the thousands of healthcare providers who trust Carepatron to transform their practice. Sign up today and experience the benefits of our innovative practice management software!

general practice
How is pediatric BMI calculated?

Commonly asked questions

How is pediatric BMI calculated?

Pediatric BMI is calculated using the same formula as adult BMI: weight in kilograms divided by height in meters squared (kg/m²). However, its interpretation for children and teens differs due to age and sex.
What are BMI percentiles?

BMI percentiles rank a child's BMI relative to their peers' BMI (same age and sex). For example, a BMI in the 60th percentile means the child's BMI is higher than 60% of children of the same age and sex.

How often should a child's BMI be checked?

Pediatric BMI should typically be checked annually during well-child visits, starting at age 2. More frequent assessments may be needed if there are concerns about a child's growth or weight.

Join 10,000+ teams using Carepatron to be more productive

One app for all your healthcare work