Healthcare professionals like physicians often request blood pressure charts to track and diagnose cardiovascular health concerns.
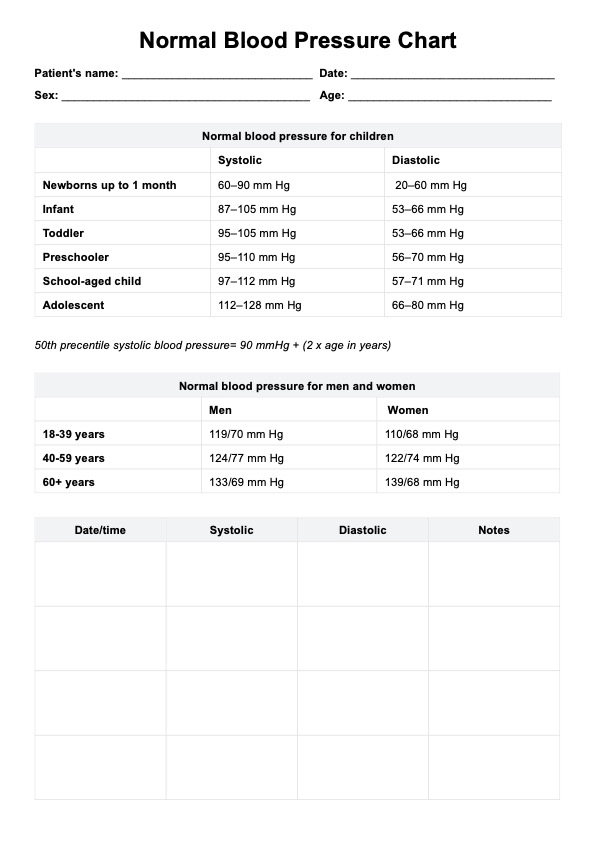
Learn normal blood pressure ranges with our Normal Blood Pressure Chart. Learn to interpret readings and maintain heart health effectively.

Healthcare professionals like physicians often request blood pressure charts to track and diagnose cardiovascular health concerns.
It is used in various contexts to monitor and assess blood pressure ranges and levels. Both practitioners and patients can utilize them.
It is a tool for tracking and interpreting blood pressure readings gathered through a sphygmomanometer or automated blood pressure monitor over time.
EHR and practice management software
*No credit card required
Free
$0/usd
Unlimited clients
Telehealth
1GB of storage
Client portal text
Automated billing and online payments


