Hormone

This handy guide outlines the insightful benefits of a hormone chart tool, how it can be used to best serve your patients, what some general result interpretations mean, and the steps going forward.

By Harriet Murray on May 09, 2024.

Fact Checked by Nate Lacson.

Use Template

What is a Hormone Chart?

A hormone chart is a visualization and tracking tool that healthcare professionals can utilize for the monitoring of hormone levels and their changes in the body over some time. Commonly referred to as a menstrual cycle hormone chart or a menopause hormone levels chart, this tool is essential for informed and holistic care, especially in the women's health space. Monitoring and tracking of male hormones is also incredibly valuable and further information as well as a male-specific hormone charting tool can be found here. At Carepatron we’ve created a streamlined chart that can support menstrual cycle tracking, hormone therapy monitoring, fertility tracking, and the management of hormonal disorders. 

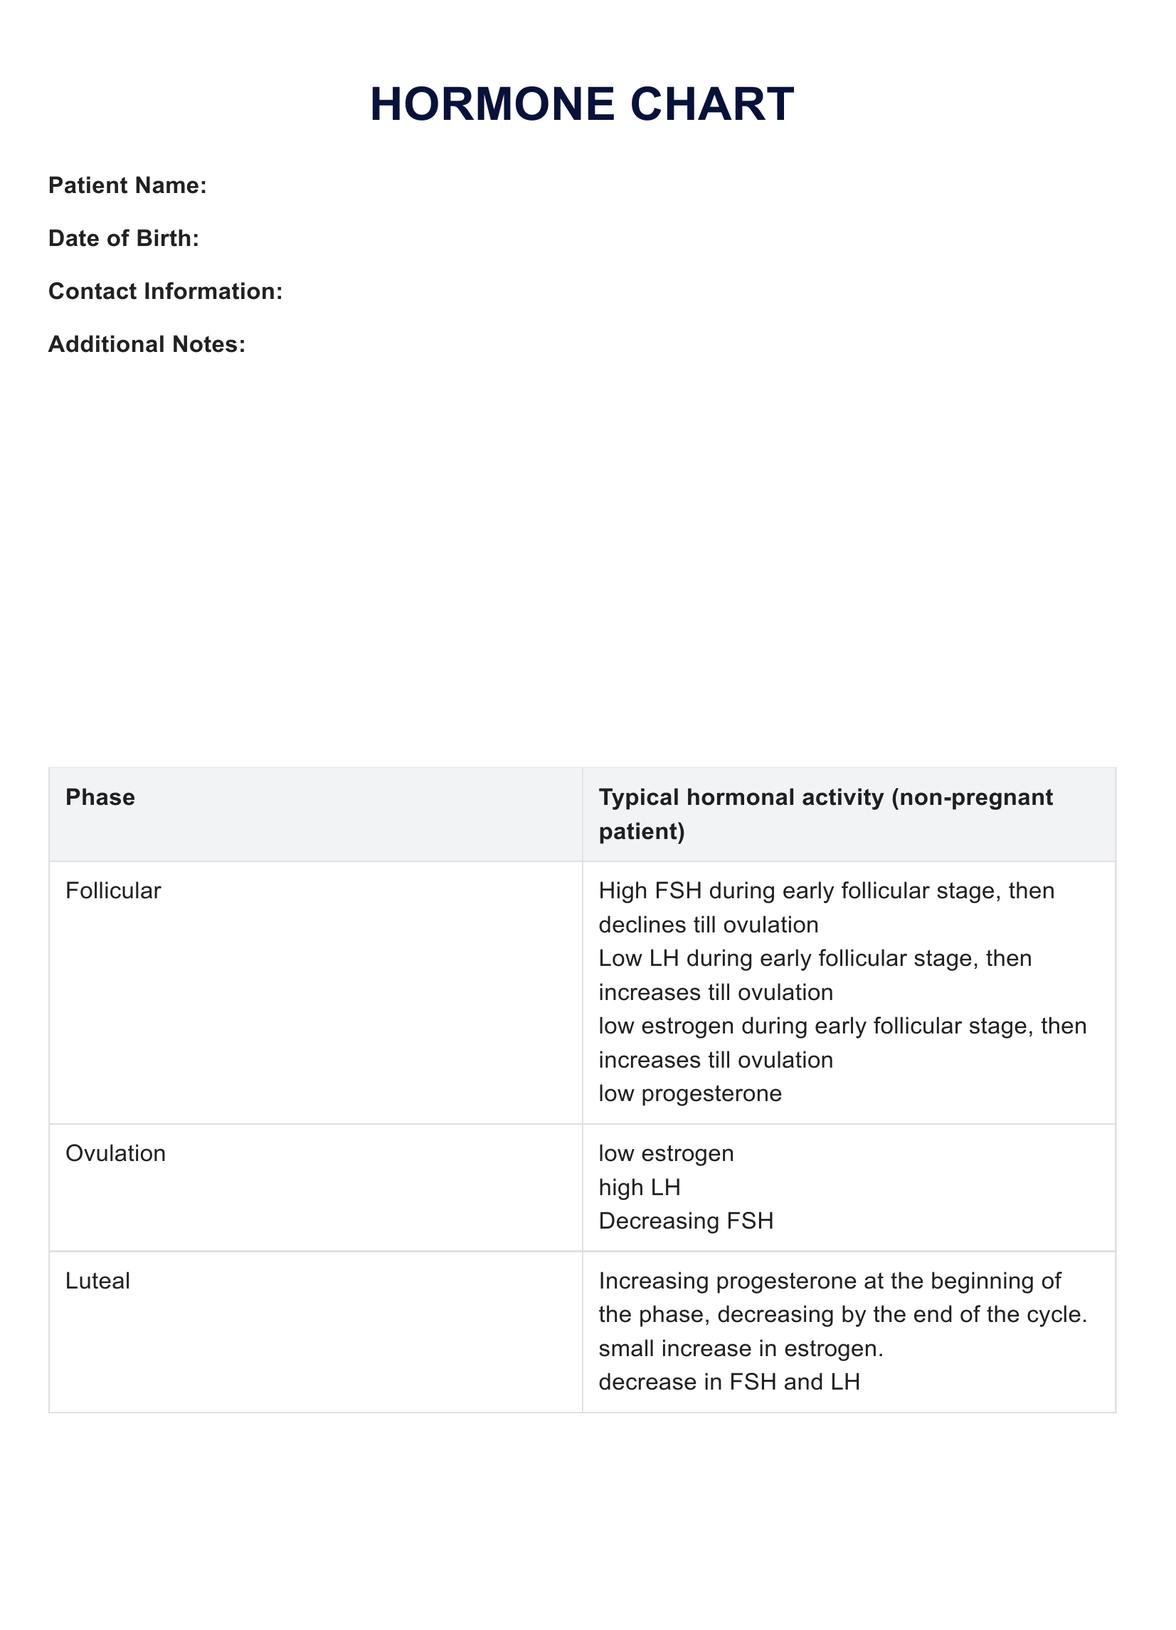
This accessible tool for both the patient and the physician helps conclude the way hormones act as chemical messengers and their role in reproductive functions, metabolism, and growth. Hormones are key, they dictate our everyday lives, and by identifying imbalances you can offer patients a great deal of beneficial treatments. Hormone charting aims to diagnose and identify irregular patterns and indicates the need for further investigation through biological markers. Saliva testing, blood testing, and looking at the levels of the follicle-stimulating hormone (FSH) are all further steps that can be taken when key information is derived from hormonal charting. 

Typically based on a timeline or calendar form, a patient with female anatomy can mark hormone-related events such as length and heaviness of menstruation, changes in cervical mucus, and basal body temperature as well as mood. All of these factors help the clinician to conclude the individual's cycle and where progesterone, estrogen, FSH, and luteinizing hormones interact and either sit in excess or depletion.

Free Hormone Chart PDF

For closer monitoring, check out our free Hormone Chart PDF

How does it work?

Step One: Obtain a copy of the template 

  • Download a copy of the printable hormone chart template from Carepatron’s template library by searching for “Hormone Chart” or download the template here! 

Step Two: Data collection 

Distribution to the client is essential with allowance for both the ovarian cycle and uterine cycle to be completed before the data is reviewed, this helps to ensure all phases of the menstrual cycle are observed and can sit anywhere between 23 to 35 days. Easily share and encourage interaction in this hormone chart with your client through Carepatrons’ Free Patient Portal Software.

Step Three: Analyze and Interpret 

  • Review the information gathered by the patient and conclude their hormone levels based on the timing of their period and noted symptoms. Everyone has a different ‘normal’ when it comes to hormonal cycles but by comparing the patients' data to the recommended parameters in the chart, a clearer picture of hormonal fluctuations can be gained and a sense of knowledge and understanding can then be offered back to the patient.

Hormone Chart Example (sample)

Want to see this resource in action? We’ve created a free and downloadable hormone chart PDF template that's been completed to show you just how this chart can work and benefit the care you offer to your patient. The answers in this file are completely fictional but aid in the educational purposes of the chart and can assist your client in confident use of the resource. 

Quickly and easily access this chart and save a copy by clicking the “Download Example PDF” button, or simply view the sample below. 

Download our Hormone Chart PDF here

When would you use this Chart?

Monitoring and Identification  

A hormone chart is a tool that requires no initial medical intervention and can be a non-intrusive way of offering insight into the hormonal fluctuations during the female menstrual cycle. By utilizing the recommended parameters section of the chart, issues can be identified should the patient sit outside of these. Using the tool to identify parts of the cycle where hormones drop or fluctuate can also offer your patient a sense of reassurance over symptoms like fatigue, concentration issues, low mood, and irritability. 

Diagnosis 

This chart is not intended to diagnose hormonal-based issues such as polycystic ovary syndrome or offer exact ovulation periods, rather it's a stepping-stone tool to help identify if there’s an underlying issue and if further investigation and treatment is needed. 

Education

This resource is extremely helpful in the education of cycles for women coming off contraception, patients wishing to begin a fertility journey, those who are concerned about the duration of their period, and healthcare professionals wanting to see a wider picture of their patients' hormonal health. This is a great resource to use in conjunction with blood testing and helps collate both symptoms with phases.

What do the results mean?

Menstruation begins on the first day of bleeding and is expected to last up to 8 days, with the average lasting around five to six. Here, levels of estrogen and progesterone are expected to be low. If your patient exceeds 8 days, further testing is desirable for hormonal imbalance and iron depletion. 

During the proliferative phase which is encapsulated in the follicular phase, estrogen levels rise to act as a catalyst for uterine lining growth. Physical change to the ovaries begins and an increase in FSH is expected. Imbalance here may require testing and investigation into pituitary gland function. 

At approximately day 13 -15 ovulation begins but can vary with each cycle. Estrogen levels increase and trigger the surge in luteinizing hormone, a dramatic drop in estrogen levels is expected soon after ovulation. If the luteinizing hormone isn’t increasing and the patient is not on a progesterone-based contraceptive, an imbalance in progesterone may be inhibiting the increase of luteinizing hormone and preventing ovulation. 

During the secretory phase post ovulation, an increase in progesterone is expected with the prostaglandins reaching their peaks at the beginning of the next cycle. If the patient is not pregnant the progesterone will peak and then drop and can be identified through common symptoms such as headaches, mood changes, acne, and breast tenderness. The decrease of progesterone and estrogen at the end of their cycle causes menstruation, indicating the beginning of a new phase. 

Variety in the duration of the period and ovulation is expected, therefore parameters act as soft guidelines. The results from this free hormone chart are for educational purposes and to help navigate future decision-making. It is a much-needed and utilized tracking tool to assist in the well-being of your patient.

Why use Carepatron as your Hormone chart app?

Engaging with Carepatron as your Hormone Chart App is a fantastic choice for easy tracking and safe distribution of data between patients and health service providers. Through our centralized workspace, you can manage clinical documentation and seamlessly set patient appointment reminders so that review and consultation over hormone tracking can occur without a setback, making you a confident provider and your patient a reassured customer. 

The integrated system we’ve created means that all documentation and history stays in one place, making your hormone chart easily accessible and allowing for more time and effort spent on the delivery of superior care, rather than chasing files. With a regularly updated document such as a hormone chart the online patient portal is a great feature for collaboration. Radicalising accessibility, our services are available on all devices but this doesn't mean we’ve endangered your information. Patient and practitioner information is safeguarded under our global compliance with global security requirements such as HIPAA, GDPR, and HITRUST. 

Access resources like this and much more by creating an account today! Join the movement of thousands of healthcare practitioners utilizing Carepatron to support their practice in the delivery of efficient, safe, and accessible care.

Practice Management Software Benefit

References

Cleveland Clinic. (2022, April 4). Hormonal imbalance: Causes, symptoms & treatment. Cleveland Clinic. https://my.clevelandclinic.org/health/diseases/22673-hormonal-imbalance

Ford, A., De Togni, G., & Miller, L. (2021). Hormonal Health: Period Tracking Apps, Wellness, and Self-Management in the Era of Surveillance Capitalism. Engaging Science, Technology, and Society, 7(1), 48–66. https://doi.org/10.17351/ests2021.655

Ray, L. (2019). Clue: Period and Ovulation Tracker for iPhone and Android. Helloclue.com; Clue. https://helloclue.com/articles/cycle-a-z/the-menstrual-cycle-more-than-just-the-period

Rosato, D. (2022, January 28). What Your Period Tracker App Knows About You. Consumer Reports. https://www.consumerreports.org/health-privacy/what-your-period-tracker-app-knows-about-you/

Who typically requests a Hormone Chart?

Commonly asked questions

Who typically requests a Hormone Chart?

Clients looking for answers about their cyclic health and primary care physicians wanting insight into the hormonal levels of their clients will typically request this chart. It is also a great tool for education about hormonal health and self-tracking.

When are Hormone Charts used?

Hormone charts are used when the physician wants a clear overview of hormonal interactions and a tool to help make further decisions in the diagnosis of hormone-related issues.

How are Hormone Charts used?

Our hormone chart template can be utilized in many ways: to support patients in beginning their menstrual tracking journey, to help identify a suspected irregular pattern, to educate patients on their hormone fluctuations, and to contribute to the wider picture of the individual's health and wellbeing.

How long does a Hormone Chart take?

The chart will take approximately 23 to 35 days to gather the data of one cycle but its daily use can take the patient less than a minute to complete making it an easy and viable data collection method.

Join 10,000+ teams using Carepatron to be more productive

One app for all your healthcare work