


What is a Menopause Hormone Levels Chart?
A Menopause Hormone Levels Chart is a reference tool used to track and monitor the levels of follicle-stimulating hormone (FSH), luteinizing hormone (LH), and estradiol (E2) in women during menopause. These hormones play a crucial role in the menstrual cycle and decrease significantly as women approach menopause.
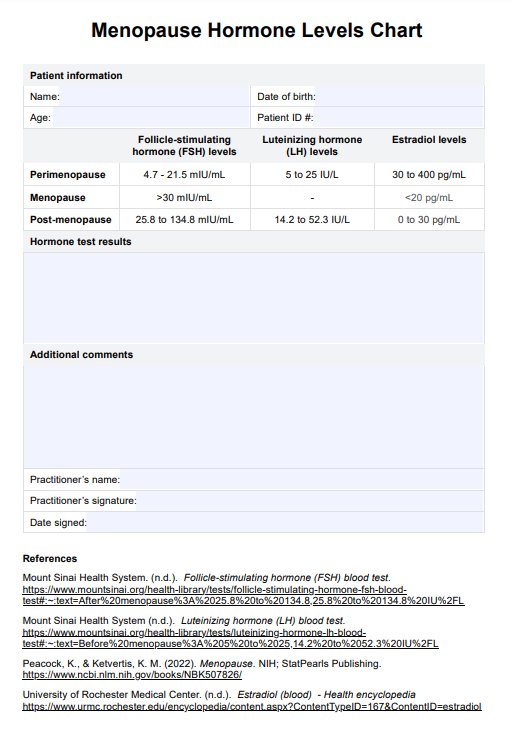
The chart typically displays the normal range of hormone levels for each stage of menopause, including perimenopause, menopause, and postmenopause. It allows healthcare providers to compare a woman's hormone levels with the expected range and determine if she is experiencing normal hormonal changes or any potential health concerns.
Menopause comes with a lot of changes, including vasomotor, urogenital, and emotional symptoms, as well as increased risks for conditions such as bone fractures and cardiovascular disease.
In the time leading up to menopause, known as perimenopause or the first part of the menopause transition, when one rarely or barely goes through the menstrual cycle, changing hormone levels can lead to a range of menopause symptoms. Examples of symptoms are hot flashes, vaginal dryness, disturbed sleep, irregular periods, and mood changes, some of which can be targeted with hormonal replacement therapy (HRT).
While there is a range of treatments to ease some of these symptoms, this chart aims to help individuals going through their menopause journey by offering a better understanding of the hormonal changes that are leading to the symptoms being experienced.


