


Understanding IQ test scores
Intelligence Quotient (IQ) scores are widely used to assess cognitive abilities, offering a snapshot of an individual’s intellectual performance relative to others. Derived from standardized tests, IQ scores measure problem-solving skills, logical reasoning, memory, and the ability to process information. These scores help professionals evaluate cognitive strengths and areas that may require further development.
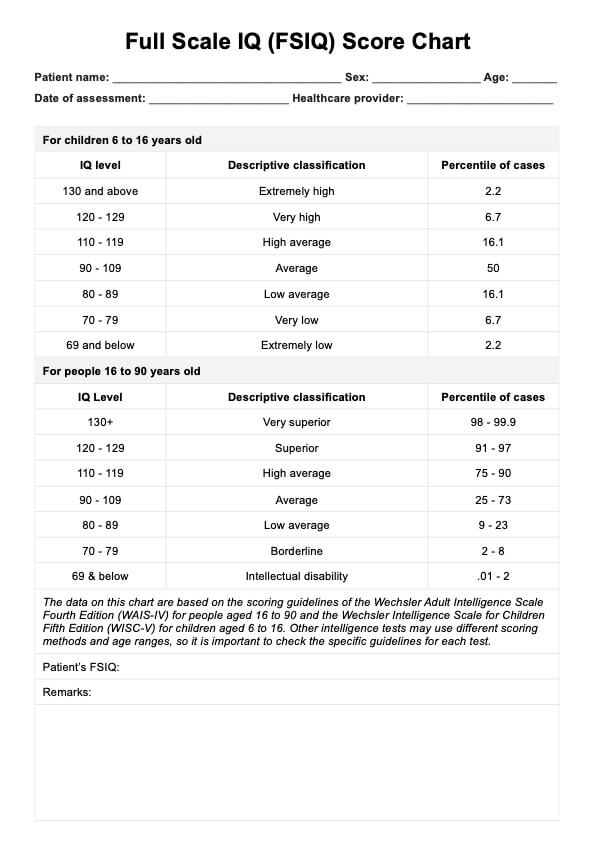
IQ testing categorizes individuals across a range of abilities, providing valuable insights into how a person’s cognitive function compares with the general population. Whether used in education, clinical settings, or career assessments of job performance, IQ scores are a key tool for understanding intellectual potential and creating personalized development plans.


