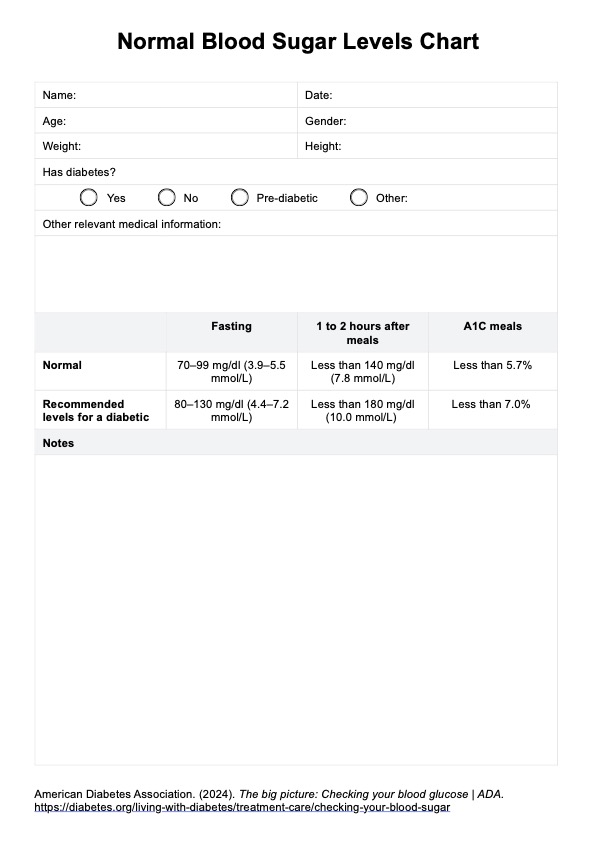
What is a Low Blood Sugar Levels Chart?

A Low Blood Sugar Levels Chart is a valuable resource that displays the various ranges of glucose levels in the bloodstream and their corresponding implications for health. This chart typically delineates the spectrum of blood sugar values, outlining the thresholds for hypoglycemia, characterized by low blood sugar levels.

The chart is a visual aid designed to assist healthcare practitioners, patients, and caregivers in understanding and interpreting glucose levels. It illustrates the target range for blood sugar levels, often detailing the critical thresholds for hypoglycemia, usually below 70 milligrams per deciliter (mg/dL). Moreover, it can include the symptomatic range associated with low blood sugar, such as dizziness, shakiness, confusion, and, in severe cases, loss of consciousness.

This resource is crucial in managing various conditions, particularly diabetes, where fluctuations in blood sugar levels are frequent. For individuals with diabetes, maintaining blood sugar within a healthy range is vital for overall well-being and preventing complications. The chart offers insights into the connection between symptoms and blood sugar levels, empowering both patients and healthcare professionals to take appropriate actions to address low blood sugar episodes promptly.

Furthermore, the chart may offer guidance on treatment strategies to raise blood sugar levels safely, such as consuming fast-acting carbohydrates or using specific medications, ensuring individuals have the necessary information to manage and prevent potentially dangerous low blood sugar incidents.

In essence, the Low Blood Sugar Levels Chart is an essential tool in proactively managing conditions related to blood sugar imbalances, facilitating informed decision-making, and contributing to improved patient outcomes and overall healthcare quality.

Printable Low Blood Sugar Levels Chart

Access our free Low Blood Sugar Levels Chart PDF here

How does it work?

The Printable Low Blood Sugar Levels Chart is a structured tool for healthcare practitioners to monitor and manage a patient's blood sugar fluctuations effectively. Here are the steps involved in using and filling out this form:

Patient Information Entry

At the top of the chart, input the patient's name and the observation date.

Blood Sugar Measurement

Record the patient's blood sugar levels at various times, such as fasting, before meals, 2 hours after meals, and at bedtime. Enter the specific numerical results in the designated columns. Interpret the results by marking whether the levels fall within the target range or below it.

Symptom Monitoring

Check the symptoms observed by the patient, such as shakiness, sweating, dizziness, confusion, weakness, rapid heartbeat, blurred vision, irritability, or other relevant symptoms. Tick the appropriate boxes to indicate the patient's experiences.

Action Plan Execution

  • Low Blood Sugar (Below Target Range): If the blood sugar levels are below the target range, administer a rapid-acting carbohydrate as recommended by the healthcare provider. Recheck blood sugar after 15 minutes and repeat the process if necessary until the levels are within the target range.
  • High Blood Sugar (Above Target Range): If blood sugar levels are above the target range, follow the healthcare provider's instructions for insulin or medication adjustments.
  • Record all actions taken and any observed changes in the patient's condition.

Notes and Recommendations

Utilize the space provided for personal notes and recommendations based on the patient's response and individual circumstances. Tailor advice to the patient's needs, habits, and any pertinent observations during the monitoring period.

Future Guidance

Discuss and review the chart with the patient, highlighting trends, triggers, and potential adjustments to their treatment plan for better self-management.

The Printable Low Blood Sugar Levels Chart acts as a collaborative tool between the healthcare practitioner and the patient, facilitating accurate monitoring, tailored interventions, and ongoing support for managing blood sugar levels effectively.

Low Blood Sugar Levels Chart Example (sample)

The Low Blood Sugar Levels Chart PDF is a comprehensive tool for monitoring glucose levels. This printable template allows healthcare practitioners to document a patient's blood sugar measurements, symptoms, and action plans. Patients' fasting, pre and post-meal blood sugar levels are recorded, indicating if they fall within or below the target range. It includes symptom checklists and a clear action plan for low or high-blood sugar scenarios. 

The PDF template is a user-friendly resource enabling practitioners to track, analyze, and provide tailored recommendations for effective blood sugar management, facilitating improved patient care and personalized treatment strategies.

Download our free Low Blood Sugar Levels Chart example PDF here

Low Blood Sugar Levels Chart Example (sample)

When Would you use this Chart?

The Low Blood Sugar Levels Chart is a crucial tool for various healthcare practitioners, particularly those involved in managing conditions such as diabetes, hypoglycemia, or other blood sugar-related issues. Its relevance in different scenarios can be outlined as follows:

Routine Monitoring and Assessments

Healthcare practitioners frequently use the chart during routine patient visits, especially for individuals with diabetes who require regular blood sugar checks. It assists in assessing and tracking blood sugar trends over time, offering insights into the effectiveness of treatments and lifestyle modifications.

Emergencies and Acute Situations

During acute hypoglycemia or emergency scenarios, this chart becomes invaluable. If a patient experiences sudden symptoms like dizziness or confusion, the chart helps document blood sugar levels, symptoms, and the immediate actions taken. This facilitates quick, appropriate responses, such as administering rapid-acting carbohydrates or prescribed measures, ensuring prompt resolution of the low blood sugar episode.

Lifestyle Changes and Treatment Plan Modifications

When patients undergo lifestyle modifications or alterations in their treatment plans, the chart is instrumental. It allows practitioners to monitor how these changes affect blood sugar levels, enabling adjustments in medications, diets, or exercise regimens.

Follow-up consultations and Long-Term Monitoring

The chart is beneficial during follow-up consultations. It helps practitioners review trends, reassess treatment effectiveness, and make informed decisions to optimize patient care. The data assists in tailoring treatment plans and interventions for long-term blood sugar management.

Educational and Patient Empowerment Purposes

The chart is a valuable educational tool for patients. Healthcare practitioners can use it to educate individuals about the relationship between their blood sugar levels, symptoms and the importance of adhering to treatment plans. It empowers patients to understand and take an active role in managing their blood sugar levels.

The Low Blood Sugar Levels Chart is a versatile resource used in various scenarios to monitor, assess, and respond to blood sugar fluctuations effectively, ensuring comprehensive and personalized care for patients managing conditions associated with fluctuating blood sugar levels.

What do the Results Mean?

The results on a Free Low Blood Sugar Levels Chart typically reflect various blood sugar measurements obtained at different times during the day, helping interpret the patient's glucose status and the potential implications for their health.

Common results on the chart may include:

Fasting Blood Sugar

This measures blood glucose after a period of fasting. Results between 70-99 mg/dL are generally considered normal. Levels above or below this range might indicate pre-diabetes, diabetes, or hypoglycemia.

Before Meals

Typically, blood sugar should be around 70-130 mg/dL before eating. Lower values might signify hypoglycemia, while higher readings could suggest uncontrolled diabetes.

2 Hours After Meals

This measures blood sugar approximately two hours after eating. Levels around 70-140 mg/dL are considered normal. Values higher than this range may indicate postprandial hyperglycemia.

Bedtime Reading

Blood sugar at bedtime should ideally range between 70-130 mg/dL. Higher or lower values might signal a need for adjustments in the patient's treatment plan or diet.

Interpreting these results is crucial. Consistently high blood sugar may signify uncontrolled diabetes, potentially leading to long-term complications like nerve damage or cardiovascular issues. On the other hand, recurring low blood sugar levels could lead to hypoglycemic episodes, causing dizziness, confusion, or in severe cases, unconsciousness.

The Free Low Blood Sugar Levels Chart aids healthcare practitioners in understanding trends. Consistent patterns outside the target ranges might indicate the need for lifestyle modifications, medication adjustments, or further evaluation.

However, individual interpretation is vital. A single abnormal reading does not necessarily indicate a chronic issue. Patterns and trends over time help draw more accurate conclusions, prompting healthcare professionals to recommend necessary lifestyle changes, medication adjustments, or further diagnostic tests to ensure optimal blood sugar management and overall health for the patient.

EHR software positive feedback

Research & Evidence

The use of Low Blood Sugar level charts in healthcare has a history deeply rooted in evidence-based practice, supported by research aimed at better managing conditions like diabetes and hypoglycemia. While specific research on the history of the resource itself may be limited, numerous studies emphasize the importance and efficacy of blood sugar level monitoring in patient care.

For instance, a study by Papatheodorou et al. (2018) highlighted the significance of continuous glucose monitoring (CGM) systems in managing diabetes, underlining the value of tracking blood sugar fluctuations for improved patient outcomes. This study emphasized the practicality of consistent monitoring and its influence on patient behavior and glycemic control.

Similarly, research by Monnier et al. (2018) focused on the impact of postprandial glycemia on overall blood glucose control and its association with long-term complications in diabetes. Their findings stressed the importance of monitoring blood sugar after meals, shedding light on keeping postprandial levels within specific ranges to minimize diabetic complications.

Furthermore, studies such as those by Seaquist et al. (2019) and Kudva et al. (2021) highlighted the necessity of recognizing and managing hypoglycemia, underlining its potential harm and the importance of prompt corrective measures.

Though specific research on the history of the Low Blood Sugar Levels Chart might be limited, these studies underscore the broader significance of monitoring blood sugar levels in diabetes management. The use of such charts aligns with the overarching principles of these studies, emphasizing the critical role of monitoring and responding to blood sugar fluctuations for optimized patient care and better health outcomes

Commonly asked questions

How is a Low Blood Sugar Levels Chart useful?

It is instrumental in documenting and interpreting blood sugar measurements, offering insight into trends, and aiding healthcare practitioners in adjusting treatment plans.

What blood sugar levels are considered low?

Typically, blood sugar levels below 70 mg/dL are regarded as low. However, symptoms and individual responses may vary, requiring personal interpretation.

How often should I check my blood sugar using the chart?

The frequency may vary based on individual health conditions and treatment plans. Typically, it is recommended to check before meals, after meals, and at bedtime.

What actions should I take if my blood sugar is low?

The chart guides immediate actions if blood sugar levels fall below the target range, such as consuming fast-acting carbohydrates and rechecking after 15 minutes.

Why use Carepatron as your Low Blood Sugar Levels app?

Carepatron is a leading healthcare management software that offers a comprehensive and user-friendly Low Blood Sugar Levels Chart app. Its intuitive design allows for easy creation, customization, and utilization of the chart, enabling efficient data entry and real-time monitoring of blood sugar measurements. This feature is crucial for identifying patterns and enabling timely interventions for patients with conditions like diabetes or hypoglycemia. 

Carepatron is designed with data security and privacy in mind, adhering to HIPAA and other regulatory requirements. Its versatility allows for seamless integration with various healthcare systems, enhancing interoperability and incorporating blood sugar data into patient records. The platform also emphasizes patient engagement, allowing shared access to the chart and fostering collaboration between patients and healthcare providers.

Advanced analytics tools enable in-depth analysis of blood sugar trends and patterns, empowering healthcare practitioners to make informed decisions and tailor treatment plans for optimal patient care.

Carepatron is an ideal platform for managing blood sugar-related conditions in healthcare settings due to its user-friendly interface, data security measures, integration capabilities, patient engagement focus, and advanced analytics.

EHR software

References

Kudva, Y. C., Ahmann, A. J., Bergenstal, R. M., Gavin, J. R., Kruger, D. F., Maloney, T., & Wesorick, D. H. (2021). Approach to using trend arrows in the FreeStyle Libre Flash Glucose Monitoring Systems in adults with insulin-requiring diabetes. Endocrine Practice, 27(7), 657–674. https://doi.org/10.1016/j.eprac.2021.01.016

Monnier, L., Colette, C., & Owens, D. R. (2018). Glycemic variability: the third component of the dysglycemia in diabetes. Is it important? How to measure it? Journal of Diabetes Science and Technology, 12(2), 439–447.

Papatheodorou, K., Banach, M., Bekiari, E., Rizzo, M., & Edmonds, M. (2018). Complications of Diabetes 2018. Journal of Diabetes Research, 2018, 3086167. https://doi.org/10.1155/2018/3086167

Seaquist, E. R., Anderson, J., Childs, B., Cryer, P., Dagogo-Jack, S., Fish, L., Heller, S. R., & Rodbard, H. (2019). Hypoglycemia and diabetes: A report of a workgroup of the American Diabetes Association and the Endocrine Society. Diabetes Care, 42(1), 138–145. https://doi.org/10.2337/dci18-0022

How is a Low Blood Sugar Levels Chart useful?
Written by
Bernard Ramirez
Bernard Ramirez

Join 10,000+ teams using Carepatron to be more productive

One app for all your healthcare work