Blood Sugar Levels Chart

Manage your health with our comprehensive Blood Sugar Levels Chart, helping you track and understand glucose levels for optimal well-being

By Bernard Ramirez on Apr 08, 2024.

Fact Checked by Ericka Pingol.

Use Template

What is a Blood Sugar Levels Chart?

A Blood Sugar Levels Chart is a visual tool that displays the range of blood glucose levels within a specific timeframe. It serves as a reference guide for individuals, healthcare professionals, and patients managing conditions like diabetes or monitoring overall health.

Typically, the chart showcases various blood sugar levels and their corresponding classifications. These levels are often categorized as normal, low, high, and critical, helping individuals interpret their blood glucose readings. The chart might illustrate measurements in milligrams per deciliter (mg/dL) or millimoles per liter (mmol/L), indicating fasting blood sugar, post-meal readings, or levels taken at different times of the day.

For instance, a typical blood sugar chart might present the following categories:

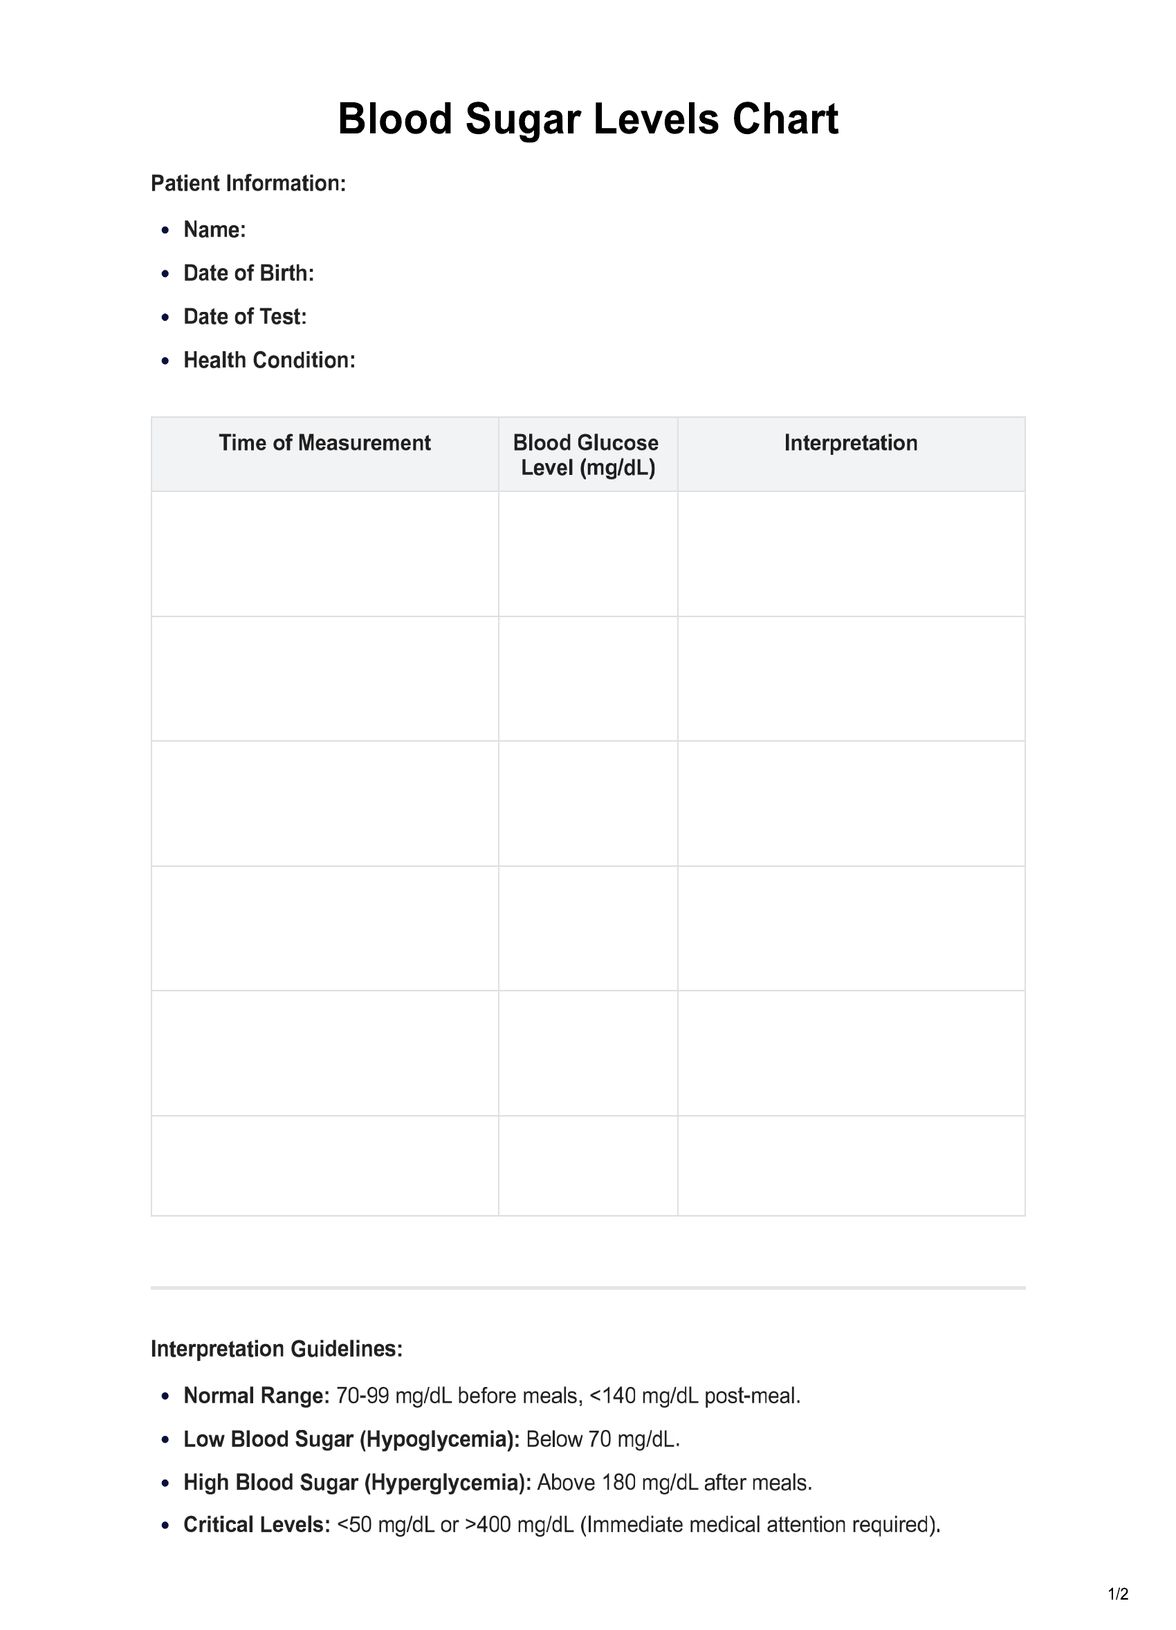
  • Normal range: Displaying optimal blood sugar levels, typically between 70 to 99 mg/dL before meals and below 140 mg/dL after eating.
  • Low blood sugar (Hypoglycemia): Representing levels below the standard range, potentially causing dizziness, confusion, and fatigue. It usually falls below 70 mg/dL.
  • High blood sugar (Hyperglycemia): Highlighting elevated glucose levels, which could indicate diabetes or the need for lifestyle adjustments. Readings may surpass 180 mg/dL after meals.
  • Critical levels: Indicating dangerously high or low blood sugar that necessitates immediate medical attention to prevent severe complications.

Individuals use this resource to monitor their blood sugar regularly, providing insights into their health status and enabling timely intervention when levels deviate from the norm. Healthcare professionals rely on these charts to guide treatment plans and educate patients about maintaining healthy blood sugar levels through diet, exercise, medication, and lifestyle modifications. Overall, the Blood Sugar Levels Chart is an essential tool in managing diabetes and promoting overall well-being by facilitating better understanding and control of blood glucose levels.

Printable Blood Sugar Levels Chart

Download our free Blood Sugar Levels Chart to better understand your sugar intake management

How Does it Work?

Utilizing a Printable Blood Sugar Levels Chart involves several steps to effectively monitor and track an individual's blood glucose readings.

Accessing the Chart

Obtain a printable Blood Sugar Levels Chart from a reputable healthcare source, ensuring it includes spaces for date, time of measurement, and blood glucose levels. It should also have sections for interpretation, recommendations, and follow-up plans.

Personal Information

Start by entering the patient's details at the top of the form. Input their name, date of birth, date of test, and any pertinent health conditions, like diabetes type or other relevant ailments.

Recording Blood Glucose Levels

Fill in the chart at specified times as per the monitoring plan. Measure and note the blood glucose levels corresponding to different times of the day, such as fasting (before breakfast), pre-meal (before lunch and dinner), bedtime, postprandial readings (1-2 hours after meals), and any other specified times.

Interpreting Readings

Utilize the interpretation guidelines provided on the form to assess the recorded blood sugar levels. Determine if the levels fall within the normal range, indicate hypoglycemia, hyperglycemia, or critical conditions, providing insights into the patient's current health status.

Recommendations and Adjustments

Based on the interpretations, suggest appropriate recommendations. This may include dietary changes, exercise plans, medication adjustments, and additional remarks to aid in managing blood sugar levels effectively.

Follow-up Planning

Schedule a follow-up appointment with the patient to review the chart. Set a date and time, outlining an action plan. This can involve reevaluating lifestyle modifications, medication responses, and further discussions to refine the management plan.

Regular Monitoring and Customization

Encourage consistent and regular monitoring of blood sugar levels. Use the data from the chart to tailor the management plan specifically to the patient's needs, ensuring it aligns with their lifestyle and health conditions.

By following these steps and using a Printable Blood Sugar Levels Chart, healthcare practitioners can effectively track, interpret, and personalize management plans for their patients, thereby fostering better control and understanding of their blood glucose levels.

Blood Sugar Levels Chart Example (sample)

The Blood Sugar Levels Chart PDF is a comprehensive, downloadable tool for tracking blood glucose levels. This printable form contains sections for date, time of measurement, and interpretations, aiding in assessing readings. It helps monitor fasting, pre/post-meal levels, and provides guidelines for hypoglycemia, hyperglycemia, and critical conditions. The chart offers areas for tailored recommendations, adjustments in diet, exercise plans, and prompts for follow-up appointments. With clear, organized sections, this PDF resource empowers healthcare practitioners to create personalized management strategies for patients, promoting better control and understanding of blood sugar levels.

Download this Blood Sugar Levels Chart Example here:

When Would you use this Chart?

Healthcare practitioners, including doctors, nurses, endocrinologists, and diabetes educators, find the Blood Sugar Levels Chart an invaluable tool for various situations related to monitoring and managing blood glucose levels.

Diagnosis and Monitoring

When diagnosing diabetes or other blood sugar-related conditions, this chart is crucial for recording initial blood glucose readings. It's essential for monitoring changes over time, enabling practitioners to assess the effectiveness of treatments and interventions. Regular use helps to establish patterns in a patient's blood sugar levels, facilitating informed decisions about their care plan.

Treatment Adjustment

For patients with existing diabetes, the chart assists in evaluating the impact of medications, insulin, dietary changes, and lifestyle modifications on blood glucose levels. It aids in making necessary adjustments to treatment plans, ensuring that interventions are tailored to each individual's specific needs and responses.

Educational Tool

The Blood Sugar Levels Chart serves as an educational aid for patients. Practitioners use it to explain the significance of different blood glucose levels, helping patients comprehend their condition and the importance of consistent monitoring. By using the chart, practitioners can visually demonstrate how various factors such as diet, exercise, and medication influence blood sugar levels.

Emergency Situations

In emergency or critical care settings, this chart provides a quick reference for assessing a patient's blood sugar levels. It aids in identifying and managing severe hypoglycemia or hyperglycemia, prompting immediate and appropriate interventions.

Follow-Up Appointments

Practitioners use the chart to facilitate follow-up appointments, allowing a comprehensive review of a patient's blood sugar trends and response to treatment. It aids in refining care plans, setting new goals, and discussing adjustments necessary for maintaining optimal blood glucose levels.

What do the Results Mean?

The interpretation of results on a Free Blood Sugar Levels Chart is pivotal in understanding an individual's blood glucose status. Here are common readings and their implications:

Fasting Blood Sugar (Before Breakfast)

Readings between 70-99 mg/dL are typically considered normal. Higher levels might suggest prediabetes or diabetes. Consistent elevation may indicate insulin resistance, prompting lifestyle modifications.

Pre-Meal Readings

Similar to fasting levels, pre-meal readings should generally fall within the normal range. Elevated values may signify insufficient insulin production or poor insulin utilization.

Post-Meal (1-2 Hours After Eating)

Normally, blood glucose might temporarily rise, but it should return to levels below 140 mg/dL. Higher readings often indicate poor glucose control, suggesting dietary imbalances or insufficient insulin action.

Bedtime Readings

Levels around 100-120 mg/dL before bed are considered good. Higher readings could indicate an increased risk of morning hyperglycemia, potentially requiring adjustments in dinner or evening snack choices.

Hypoglycemia (Low Blood Sugar)

Readings below 70 mg/dL may result in symptoms such as dizziness, confusion, or shakiness. This condition necessitates immediate treatment with fast-acting carbohydrates to raise blood sugar levels.

Hyperglycemia (High Blood Sugar)

Consistent readings above 180 mg/dL indicate poorly managed diabetes, potentially leading to long-term complications. Addressing high blood sugar involves dietary adjustments, medication changes, and increased physical activity.

Understanding these readings is essential for healthcare practitioners and individuals monitoring their blood sugar. Consistent patterns outside the normal range require action. Utilizing the Free Blood Sugar Levels Chart aids in comprehending these results, facilitating informed decisions, and enabling better management of blood glucose levels to maintain overall health and prevent complications associated with imbalanced blood sugar levels.

Clinical documentation software positive benefit

Why use Carepatron as your Blood Sugar Levels app?

Carepatron's Blood Sugar Levels Chart app and software are a comprehensive and user-friendly tool for managing blood sugar levels. The app offers a personalized experience for users, allowing them to input, track, and analyze blood glucose readings. It offers various options for recording fasting, pre-meal, post-meal, and other time-specific readings, providing a comprehensive overview of blood sugar trends. The app also provides real-time data accessibility, allowing users to monitor their blood sugar levels and healthcare professionals to remotely access and review the data, enabling timely interventions and personalized recommendations.

The software includes intelligent interpretation tools that assist in interpreting results, providing automatic interpretations based on entered blood glucose levels. It also offers tailored recommendations for lifestyle adjustments, dietary changes, and medication alterations. The platform ensures data security and privacy, promoting collaborative care. The user-friendly interface and excellent customer support further enhance the user experience.

Carepatron's Blood Sugar Levels Chart app and software are an excellent choice for individuals and healthcare professionals seeking to effectively manage blood sugar levels.

Clinical documentation software

References

American Diabetes Association. (2019). Standards of Medical Care in Diabetes. Diabetes Care, 42(Suppl 1), S1-S193.

Inzucchi, S. E., et al. (2018). Management of Hyperglycemia in Type 2 Diabetes, 2018. Diabetes Care, 41(12), 2669-2701.

Rodbard, D. (2019). Continuous Glucose Monitoring: A Review of Recent Studies Demonstrating Improved Glycemic Outcomes. Diabetes Technology & Therapeutics, 21(S2), S25-S37.

Why is it important to monitor blood sugar levels?

Commonly asked questions

Why is it important to monitor blood sugar levels?

Monitoring blood sugar levels is crucial, especially for individuals with diabetes. It helps in understanding how food, exercise, medication, and other factors affect glucose levels, enabling better management and reducing the risk of complications.

What do the numbers on the chart represent?

The numbers represent blood glucose levels measured in milligrams per deciliter (mg/dL) or millimoles per liter (mmol/L). These values signify the amount of sugar present in the blood at different times, such as before meals, after meals, or at bedtime.

What are the normal blood sugar levels according to the chart?

Typically, normal blood sugar levels are considered to be between 70-99 mg/dL before meals and below 140 mg/dL after meals for most individuals.

Join 10,000+ teams using Carepatron to be more productive

One app for all your healthcare work