Non Fasting Blood Sugar Levels Chart

Understand Non Fasting Blood Sugar Levels Chart clinical significance in managing blood sugar levels and optimizing patient care.

By Olivia Sayson on Apr 08, 2024.

Fact Checked by Ericka Pingol.

Use Template

What is a Non Fasting Blood Sugar Levels Chart?

Understanding blood glucose level ranges can be a key part of diabetes self-management. It empowers individuals to navigate their condition effectively, make informed decisions about their daily activities, and respond promptly to fluctuations in their blood sugar levels.

The Non Fasting Blood Sugar Levels Chart can be a crucial tool in this process, helping individuals with diabetes monitor and manage their condition more efficiently. By regularly tracking non-fasting blood sugar levels using this chart, individuals can gain valuable insights into how their blood sugar fluctuates throughout the day, even when they haven't been fasting.

This data can be instrumental in tailoring their dietary choices, medication, or insulin dosages, ensuring they maintain optimal blood sugar control and effectively self-manage their diabetes. In essence, the Non Fasting Blood Sugar Levels Chart can be vital in empowering individuals to take charge of their health and work toward their diabetes management goals.

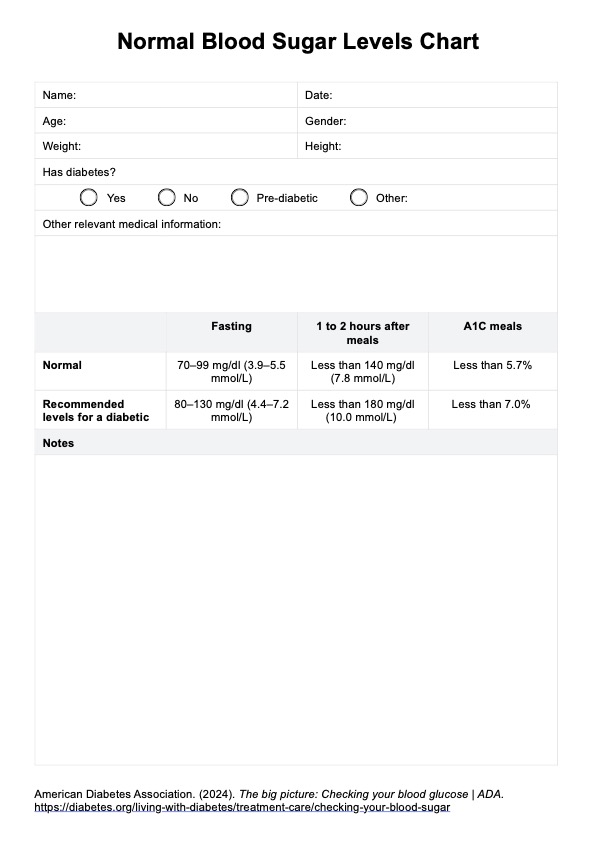
Printable non fasting blood sugar levels chart

Check out our free non fasting blood sugar levels chart

How Does it Work?

Effectively utilizing our Printable Non Fasting Blood Sugar Levels Chart involves a streamlined five-step process tailored to healthcare practitioners:

Step 1: Accurate Recording of Patient Information

Carefully record the pertinent patient information, including blood sugar readings at various times of the day, along with associated details such as test dates and relevant clinical information

Step 2: In-Depth Blood Sugar Analysis

This is the stage where you delve into the gathered data. Analyze the blood sugar readings and provide thorough clinical interpretations. These insights empower you to make well-informed decisions regarding your patients' conditions and treatment plans.

Step 3: Personalized Care Plan Development

Based on your analysis and clinical insights, outline individualized care plans catering to each patient's needs. These plans may encompass tailored dietary recommendations, exercise routines, or medication adjustments to achieve optimal blood sugar control and overall health.

Step 4: Ongoing Monitoring for Better Outcomes

Your commitment to patient care continues after the initial data entry and analysis. Continuously monitor and update the chart to track your patient's progress. This allows you to modify the care plan as conditions change or improve.

Step 5: Empowering Patients in Their Health Journey

The final step is to engage with your patients and involve them in their health management. Share the chart and your insights, explaining the implications and progress.

Non Fasting Blood Sugar Levels Chart Example (sample)

Our Non Fasting Blood Sugar Levels Chart PDF includes example responses, offering step-by-step instructions for its use. Whether you're an experienced practitioner or new to using this chart, we've designed this resource to provide you with comprehensive clinical documentation software.

Integrate the Non Fasting Blood Sugar Levels Chart into your practice to enhance patient care and contribute to better health outcomes. At Carepatron, we're here to support you every step of the way, and this chart is just one of the tools we offer to help you excel in your clinical practice.

Download this Non Fasting Blood Sugar Levels Chart here:

Non Fasting Blood Sugar Levels Chart Example (sample)

When Would You Use This Chart?

The Non Fasting Blood Sugar Levels Chart primarily focuses on diabetes management, offering the means to regularly track blood sugar levels for effective treatment adjustments. 

It also finds utility in assessing blood sugar dynamics in individuals with metabolic disorders like metabolic syndrome and PCOS. Moreover, the chart aids in weight management by evaluating blood sugar sensitivity and guiding personalized lifestyle changes. It enhances the comprehensiveness of routine health check-ups, providing vital insights into patients' blood sugar health and catering to a broad spectrum of healthcare needs.

Practice management software positive feedback

What do the Results Mean?

Understanding non-fasting blood sugar levels is crucial for diabetes self-management. For a non-diabetic individual, normal non-fasting blood sugar levels can vary depending on when and how blood sugar levels are tested. 

When using our Free Non Fasting Blood Sugar Level Chart, it's important to note that two hours after a meal, a typical non-fasting blood sugar reading for a non-diabetic person is generally below 140 mg/dl (7.8 mmol/L). In a random blood sugar level test involving blood sample collection at any random time, regardless of the last meal consumed, a regular non-fasting blood sugar reading is often below 200 mg/dl (11.1 mmol/L). 

For those with diabetes, this chart can help manage blood sugar levels effectively, offering specific target ranges, like keeping non-fasting blood sugar levels below 180 mg/dl (10.0 mmol/L) two hours after a meal. Consulting with a healthcare professional is essential for setting personalized and appropriate blood sugar level targets.

Why Choose Carepatron for Your Non-Fasting Blood Sugar Levels Chart?

Carepatron brings you a comprehensive suite of cutting-edge tools, including Non-Fasting Blood Sugar Levels Chart app and Non-Fasting Blood Sugar Levels Chart software for monitoring non-fasting blood sugar levels. These solutions are thoughtfully tailored to cater to your diverse healthcare requirements.

Our patient portal software helps healthcare professionals like you, providing an efficient platform for patient interaction. This software enables patients to access their medical records, fostering seamless communication and engagement. In addition, our healthcare payment software simplifies billing processes and financial management, easing administrative burdens and enhancing financial transparency.

Our patient appointment reminder software is at your service to ensure your scheduling processes run smoothly.

By incorporating Carepatron's seamlessly designed solutions, you can streamline your workflow, automate tasks, and enhance productivity. With our dedicated support team, you are never alone when navigating our software, and our unwavering commitment to data security guarantees the protection of your patient's sensitive information.

Join the community of healthcare practitioners who rely on Carepatron to propel their practice to new heights with our innovative and efficient software solutions.

Practice management software

Who typically requests a Non Fasting Blood Sugar Levels Chart?

Commonly asked questions

Who typically requests a Non Fasting Blood Sugar Levels Chart?

Healthcare professionals like doctors and nurses typically request these charts to monitor patients' blood sugar levels in non-fasting conditions, often for diabetes management.

When are Non Fasting Blood Sugar Levels Charts used?

They assess blood sugar levels when fasting is not required, offering insights into glycemic control throughout the day.

How are Non Fasting Blood Sugar Levels Charts used?

Blood sugar measurements at various times are recorded on the chart to monitor trends, inform treatment decisions, and assess glucose control in non-fasting conditions.

How long does a Non Fasting Blood Sugar Levels Chart take?

The time varies based on monitoring needs, with measurements taking a few minutes each and the chart often covering weeks or months for long-term data collection.

Join 10,000+ teams using Carepatron to be more productive

One app for all your healthcare work