Measuring pain intensity
Pain intensity refers to the severity or magnitude of the pain experienced. This helps healthcare professionals determine the appropriate course of treatment and monitor the effectiveness of interventions. Pain intensity can range from mild to severe, significantly impacting a person's quality of life, physical activity, and overall well-being (Dansie & Turk, 2013).
Healthcare practitioners have several tools and scales at their disposal to measure and document a person's pain experience effectively. Here's an overview of some commonly used methods for measuring pain severity and intensity:
- McGill Pain Questionnaire (MPQ): While pain intensity is a crucial aspect of pain assessment, it is essential to recognize that pain is a multidimensional experience. Multidimensional pain scales, such as the MPQ, provide a more comprehensive evaluation by considering pain intensity, quality, and emotional aspects (Melzack, 1975).
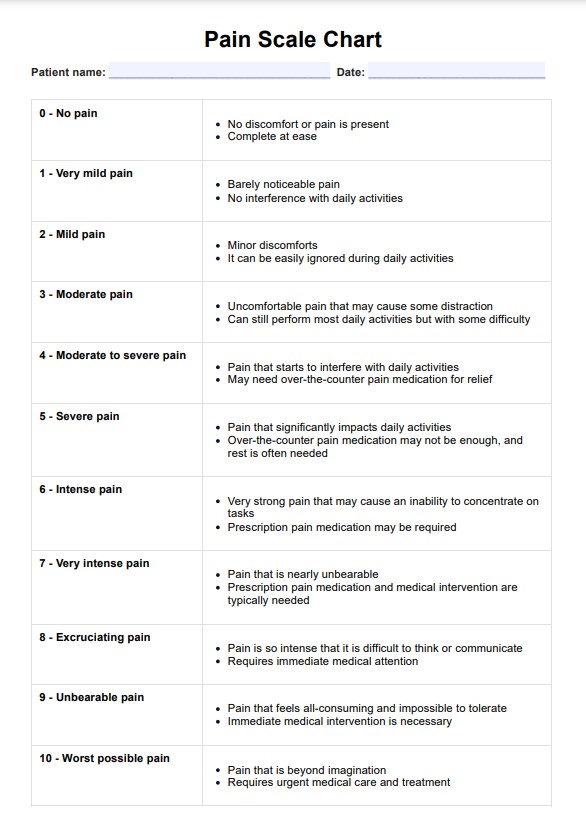
- Numerical rating scale (NRS): Numerical pain scalestypically range from 0 (no pain) to 10 (worst possible pain). Patients are asked to rate their pain intensity by choosing a number that best represents their current pain on a scale (Hjermstad et al., 2011).
- Visual analog scale (VAS): This pain inventory consists of a horizontal or vertical line, usually 10 centimeters long, with anchors at each end representing "no pain" and "worst possible pain." Patients are instructed to mark a point on the line corresponding to their perceived pain intensity (Hjermstad et al., 2011).
- Veterans pain rating scale: Developed by the Department of Veterans Affairs, this scale combines numerical ratings with descriptive words and facial expressions. Patients rate their pain intensity on a scale from 0 (no pain) to 10 (worst possible pain), with accompanying word descriptors and facial expressions to aid in selecting the appropriate rating (Polomano et al., 2016).
- Verbal rating scale (VRS): This scale uses descriptive words such as "no pain," "mild pain," "moderate pain," "severe pain," and "worst possible pain" to represent different levels of pain intensity (Hjermstad et al., 2011).
- Wong-Baker FACES pain rating scale: This scale is handy for assessing pain in children or individuals with cognitive impairments. It features six faces, ranging from a smiling face (no pain) to a crying face (the worst possible pain).


