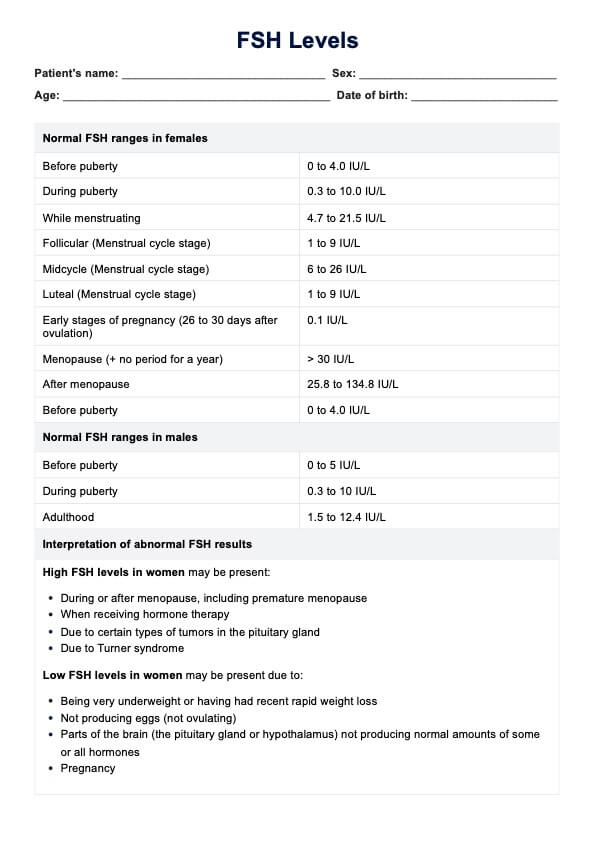
Normal FSH Levels By Age Chart

Discover Carepatron, your go-to app for managing FSH levels. Seamlessly integrate patient data and telehealth for superior healthcare delivery.

By RJ Gumban on Apr 08, 2024.

Fact Checked by Ericka Pingol.

Use Template

What is a Normal FSH Levels By Age Chart?

Navigating the complexities of fertility and hormonal health can be a daunting task for healthcare professionals. This is where the Normal FSH Levels By Age Chart becomes an indispensable tool. Follicle-stimulating hormone (FSH) plays a crucial role in the reproductive processes of both men and women. Understanding the normal FSH levels for different ages is critical to diagnosing and managing various conditions related to reproductive health.

The Normal FSH Levels By Age Chart is a comprehensive resource that outlines the expected range of FSH levels across different age groups. This chart is not just a mere collection of numbers; it reflects the intricate balance of the endocrine system and how it varies from childhood through the reproductive years and into menopause or andropause. For healthcare professionals, this chart is a guide to making informed decisions, whether it's about evaluating fertility, diagnosing disorders, or managing treatments.

In an era where patient care demands precision and personalization, integrated with Carepatron's practice management software, this chart becomes more than just a reference. It transforms into a dynamic tool that aligns with digital health records, enabling practitioners to track, analyze, and interpret FSH levels in the context of each patient's unique health journey. This integration ensures that healthcare professionals can provide care that is not only informed but also empathetic and patient-centric.

In summary, the Normal FSH Levels By Age Chart is a vital resource for healthcare professionals. It empowers them with the knowledge to navigate the complex world of hormonal health, ensuring that each patient receives the most accurate and compassionate care possible.

Printable Normal FSH Levels By Age Chart

Download this Normal FSH Levels By Age Chart to understand the normal FSH levels for different ages

How to use the Normal FSH Levels By Age Chart

Step 1: Download the Normal FSH Levels By Age Chart

The first step for healthcare professionals is downloading the Normal FSH Levels By Age Chart from Carepatron. This chart is a crucial tool for accurately assessing FSH levels in patients of different ages.

Step 2: Gather patient information

Before applying the chart, it's crucial to collect comprehensive patient information. This includes age, medical history, and symptoms related to hormonal imbalances or reproductive health issues.

Step 3: Conduct FSH testing

Perform an FSH test, typically through a blood sample. Conducting this test appropriately during the patient's menstrual cycle is essential, as FSH levels can vary.

Step 4: Refer to the chart

With the FSH test results in hand, use the downloaded chart to compare the patient's age with the corresponding FSH level range. This comparison will help determine if the patient's levels fall within a normal range.

Step 5: Interpret the results

Carefully interpret the results regarding the patient's overall health profile and reported symptoms. Abnormal FSH levels may indicate various conditions, such as menopause, ovarian dysfunction, or pituitary disorders.

Step 6: Plan further action

Based on the chart's interpretation, decide on the appropriate next steps. This might involve additional testing, specialist referrals, or initiating specific treatments.

Step 7: Follow-up and monitoring

Regular monitoring of the patient's FSH levels is crucial. Use the chart for ongoing assessments to track changes or improvements in the patient's condition.

The Normal FSH Levels By Age Chart is an essential resource for healthcare professionals. It facilitates informed decision-making and personalized patient care. Properly utilizing this chart is key to enhancing diagnostic accuracy and treatment efficacy, improving patient health outcomes.

Normal FSH Levels By Age Chart example (sample)

Including a sample version of the Normal FSH Levels By Age Chart, exemplified by the fictional patient Bernie Dickenson, is a vital tool for healthcare professionals. This sample provides a clear and practical illustration of how the chart should be filled out, ensuring accuracy and consistency in recording patient data.

It also aids in understanding the normal range of FSH levels across different age groups, as seen in Bernie's case, where her FSH level falls within the normal range for her age. This example acts as a guide, especially for new practitioners or those unfamiliar with the chart, making it an indispensable part of the learning process.

By downloading the PDF version with this sample, healthcare professionals can better grasp the application of the chart in real-world scenarios, enhancing their ability to provide informed and precise care to their patients.

Download this Normal FSH Levels By Age Chart example:

Normal FSH Levels By Age Chart example (sample)

When would you use this form?

The Normal FSH Levels By Age Chart is a critical tool for healthcare professionals, offering an apparent reference for assessing patients' Follicle-Stimulating Hormone (FSH) levels. Understanding the appropriate contexts for its use is essential for accurate diagnosis and treatment.

1. Fertility Evaluations:

  • It is essential in assessing reproductive health, particularly in infertility or irregular menstrual cycles.
  • Used during initial fertility consultations and throughout treatment processes.

2. Menopause and Perimenopause Assessments:

  • It is vital for diagnosing menopause and perimenopause, especially when patients report symptoms like hot flashes or irregular periods.
  • It helps in determining the stage of menopause and guiding hormone replacement therapy.

3. Pediatric and Adolescent Health:

  • Crucial in evaluating delayed or precocious puberty in children and adolescents.
  • Assists in diagnosing conditions like Turner syndrome or Klinefelter syndrome.

4. Endocrine Disorders:

  • They are used in diagnosing and monitoring various endocrine disorders, including Polycystic Ovary Syndrome (PCOS) and hypogonadism.
  • It helps in assessing the effectiveness of treatments for these conditions.

5. Research and Clinical Studies:

  • Utilized in clinical research focusing on hormonal changes across the lifespan or in specific conditions.
  • Aids in academic and educational settings for teaching about endocrine health.

The Normal FSH Levels By Age Chart is an invaluable resource across various medical specialties. Its use extends from reproductive health to endocrine disorders, playing a crucial role in both the diagnosis and management of patients. Understanding when to use this chart is fundamental for healthcare professionals in providing accurate and effective care.

What do the results mean?

Interpreting the results of the Normal FSH Levels By Age Chart is pivotal in understanding a patient's hormonal health. This section elucidates the significance of common results derived from the chart.

1. Normal FSH levels:

  • Indicate healthy ovarian or testicular function.
  • Suggest normal reproductive and endocrine health in the context of the patient's age.

2. Elevated FSH levels:

  • It may indicate diminished ovarian reserve in women, often seen in perimenopause or menopause.
  • In men, high FSH levels could suggest testicular dysfunction or damage.
  • Elevated levels in children might signal premature sexual development.

3. Low FSH levels:

  • It can imply hypogonadism or pituitary gland disorders.
  • In women, low FSH levels might be associated with conditions like PCOS or hypothalamic amenorrhea.
  • In men, it could indicate issues with sperm production or hormonal imbalances.

4. Fluctuating FSH levels:

  • Fluctuations can occur in transitional phases like perimenopause.
  • Inconsistent levels require further investigation to rule out underlying conditions.

The Normal FSH Levels By Age Chart results provide crucial insights into a patient's reproductive and hormonal health. Understanding these results allows healthcare professionals to make informed decisions about further diagnostic steps, treatment plans, and patient counseling. Accurate interpretation is vital to effective patient care and management

Why Use Carepatron as Your FSH Levels App?

Carepatron is the premier choice for healthcare professionals seeking a reliable and efficient way to manage FSH levels. Our platform offers a comprehensive online patient portal, simplifying tracking and analyzing FSH levels across different age groups. This portal provides easy access to patient data, enabling healthcare providers to make informed decisions based on accurate and up-to-date information.

Moreover, Carepatron's advanced features extend beyond just data management. Our telehealth platform integrates seamlessly with the patient portal, offering a holistic approach to patient care. This integration allows for real-time consultations, ensuring that any changes in a patient's FSH levels are addressed promptly and effectively. The platform's user-friendly interface allows healthcare providers and patients to easily navigate and utilize the features, enhancing the overall experience.

In conclusion, Carepatron is ideal for healthcare professionals prioritizing accuracy, efficiency, and patient-centric care. Our platform not only streamlines the process of monitoring FSH levels but also fosters a more connected and responsive healthcare environment. Choose Carepatron for a seamless, integrated approach to managing FSH levels and enhancing patient care.

Explore Carepatron today and elevate your healthcare practice.

healthcare payment software

References

Burger, H., Hale, G., Dennerstein, L., & Robertson, D. (2008). Cycle and hormone changes during perimenopause: the key role of ovarian function. Menopause, 15(4 Pt 1), 603-612. DOI:10.1097/gme.0b013e318174ea4d

Chen, J., Pan, Q., Wang, Y., & Zhou, X.-X. (2017). [Dynamic changes of reproductive hormone levels and related factors in old and middle-aged men in health examination]. PubMed. https://pubmed.ncbi.nlm.nih.gov/29658250

Erdem, A., Erdem, M., Biberoglu, K., Hayit, O., Arslan, M., & Gursoy, R. (2002). Age-related changes in ovarian volume, antral follicle counts and basal FSH in women with normal reproductive health. PubMed. https://pubmed.ncbi.nlm.nih.gov/12418067

Ferrell, R., O'Connor, K., Holman, D., Brindle, E., Miller, R. C., Rodríguez, G., Simon, J., Mansfield, P., Wood, J. W., & Weinstein, M. (2007). Monitoring reproductive aging in a 5-year prospective study: aggregate and individual changes in luteinizing hormone and follicle-stimulating hormone with age. Menopause, 14(5), 680-687. DOI:10.1097/01.gme.0000227859.50473.20

How accurate is the FSH level tracking on Carepatron?

Commonly asked questions

How accurate is the FSH level tracking on Carepatron?

Carepatron's FSH level tracking is highly accurate, utilizing the latest technology to ensure that healthcare professionals can access precise and reliable patient data.

Can patients access their FSH-level data on Carepatron?

Yes, patients can easily access their FSH-level data through Carepatron's online patient portal, which provides a secure and user-friendly platform for viewing and managing health information.

Does Carepatron offer support for telehealth consultations regarding FSH levels?

Absolutely, Carepatron includes a comprehensive telehealth platform that facilitates virtual consultations, allowing healthcare providers and patients to discuss FSH levels and related health concerns remotely and conveniently.

Join 10,000+ teams using Carepatron to be more productive

One app for all your healthcare work