Fasting Blood Glucose Levels
Monitor blood sugar levels regularly with the Fasting Blood Glucose Levels Chart. Take control of your health effortlessly.
What is a Fasting Blood Glucose Levels Chart?
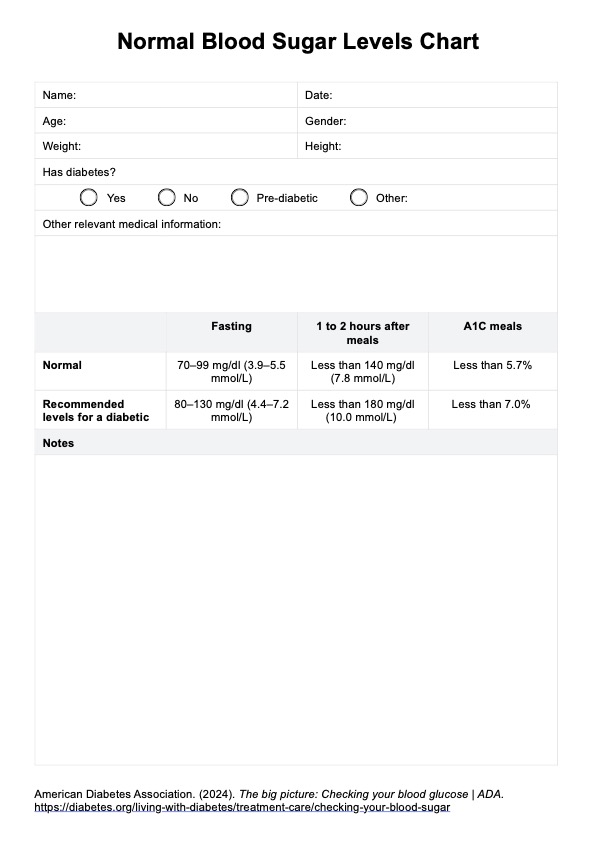
A Fasting Blood Glucose Levels Chart, often called a blood sugar chart, is a visual reference tool for tracking and interpreting blood glucose levels over time. It is pivotal in supporting individuals managing diabetes or monitoring their prediabetic status. This chart typically displays blood sugar measurements in milligrams per deciliter (mg/dL) along one axis, with time intervals, such as before and after meals, along the other.
The chart typically provides normal range values, often indicating fasting and post-meal levels. These values enable individuals to assess their blood sugar levels within healthy parameters. Deviations from these standard levels can signal prediabetes or diabetes.
This chart is valuable for identifying trends, making informed decisions regarding diet, medications, or lifestyle adjustments, and assisting healthcare providers in tailoring treatment plans. Its use empowers individuals to manage their blood sugar actively, reducing the risks associated with diabetes-related complications. Regularly utilizing Fasting Blood Glucose Levels Charts is essential for maintaining stable blood sugar control and overall well-being.
Printable Fasting Blood Glucose Levels Chart
Download this Fasting Blood Glucose Levels Chart to track and interpret blood glucose levels.
How Does it Work?
Using the Printable Fasting Blood Glucose Levels Chart is straightforward. Here are the four essential steps:
Step 1: Patient Information
Start by filling in the patient's details on the form, including their name and the test date. This information is crucial for proper record-keeping.
Step 2: Blood Glucose Measurement
Enter today's fasting blood glucose level in mg/dL in the designated space. Accuracy is vital for precise monitoring.
Step 3: Target Range Selection
Select the appropriate target range based on the provided options:
- Normal (70 - 99 mg/dL)
- Prediabetes (100 - 125 mg/dL)
- Diabetes (126 mg/dL or more)
Step 4: Notes/Comments
If needed, you can add any relevant clinical notes or comments in the designated area. This can include additional details, observations, or recommendations.
Fasting Blood Glucose Levels Chart Example (Sample)
The Fasting Blood Glucose Levels Chart Example is available in a convenient PDF format and provides a valuable tool for healthcare professionals and individuals managing diabetes. It visually represents a patient's blood glucose trends, allowing for a quick and informed assessment. Clear data on fasting and post-meal readings aids in diagnosing diabetes, prediabetes, or normal blood sugar levels.
The Fasting Blood Glucose Levels Chart PDF streamlines data interpretation, making it easier to provide precise recommendations. Whether you're a healthcare provider or an individual on a diabetes management journey, this sample chart enhances your understanding of blood glucose control. Take control of diabetes management today!
Download this Fasting Blood Glucose Levels Chart Example:

When Would You Use This Chart?
The Fasting Blood Glucose Levels Chart is an indispensable resource for healthcare practitioners. Primary care physicians and endocrinologists frequently rely on this tool during initial patient assessments to gauge blood sugar control and diagnose potential diabetes or prediabetes.
It's a pivotal element for diabetologists in monitoring treatment effectiveness and making necessary adjustments. Certified diabetes educators can use the chart as an educational aid to explain blood glucose trends to patients, empowering them with knowledge for self-management.
Additionally, nutritionists and dietitians find it valuable when crafting personalized dietary plans, as they can correlate food intake with blood sugar fluctuations. In emergency care settings, the chart helps quickly evaluate patients' blood glucose levels, aiding in prompt decisions on intervention.
Thus, this resource finds utility across a spectrum of healthcare professionals, offering vital support in diagnosis, treatment, education, dietary guidance, and emergencies, ultimately enhancing patient care and well-being.
What do the Results Mean?
The Fasting Blood Glucose Levels Chart provides crucial insights into a patient's blood sugar status, with key implications for healthcare professionals. When fasting blood sugar levels fall below 99 mg/dL, this indicates normal blood glucose control, signifying no immediate cause for concern. The 100 to 125 mg/dL range suggests prediabetes, highlighting the need for lifestyle adjustments and closer monitoring. A fasting blood sugar level of 126 mg/dL or higher typically indicates diabetes, necessitating prompt medical attention.
In the post-meal blood sugar test, results below 140 mg/dL signify normal levels, while readings between 140 and 199 mg/dL generally indicate prediabetes. Results exceeding 200 mg/dL indicate diabetes, requiring immediate intervention to manage blood sugar effectively.
These interpretations guide healthcare professionals in providing tailored care, lifestyle recommendations, and treatment strategies for their patients, thereby supporting better blood sugar management and overall health.
Research & Evidence
Fasting blood glucose (FBG) levels are a critical metric for diagnosing and understanding various health conditions. For individuals without diabetes, a normal FBG level typically falls below 100 mg/dL or 5.6 mmol/L, measured after an overnight fast. When FBG levels are higher than normal but not high enough for a diabetes diagnosis, it's categorized as prediabetes, signifying an elevated risk of developing type 2 diabetes, heart disease, and stroke.
Diabetes, a chronic condition that affects the body's glucose utilization, exists in two primary forms: type 1, an autoimmune disease, and type 2, the more prevalent form characterized by insulin resistance or insufficient insulin production.
Elevated FBG levels are linked to increased health risks, including heart disease, stroke, kidney disease, blindness, nerve damage, and amputations. Extensive research underscores these associations, with studies revealing a 2- to 3-fold heightened risk of developing type 2 diabetes, heart disease, and stroke in individuals with high FBG levels.
Commonly asked questions
Healthcare professionals, such as doctors, endocrinologists, or certified diabetes educators, often request Fasting Blood Glucose Levels Charts for their patients.
These charts are typically used when monitoring and managing blood glucose levels for individuals with diabetes or those at risk of developing diabetes.
These charts record and track blood glucose measurements over time, helping in diagnosis, treatment planning, and making informed decisions about lifestyle and medication adjustments.
Why Use Carepatron As Your Fasting Blood Glucose Levels App?
Carepatron is the ideal platform for your Fasting Blood Glucose Levels Chart app, offering a comprehensive solution that combines efficiency and versatility. As a top-tier Fasting Blood Glucose Levels Chart Software, it stands out due to its integration of various features.
Focusing on health and wellness, it goes beyond the standard offerings, making it the preferred choice for managing blood glucose levels. Whether you're a healthcare professional, therapist, or individual seeking streamlined healthcare management, Carepatron delivers.
In addition to its exceptional chart capabilities, it boasts features such as an EHR, scheduling software, clinic notes software, and telehealth software. This all-in-one approach simplifies the healthcare experience, providing you with the tools needed for efficient monitoring, seamless communication, and simplified administrative tasks, all within a single platform.
Choose Carepatron to streamline your healthcare journey and enhance your ability to manage Fasting Blood Glucose Levels with precision and ease while benefiting from other essential healthcare management tools.

References
- Prediabetes: American Diabetes Association. 2023 Standards of Medical Care in Diabetes. Diabetes Care. 46(Supplement 1): S1-S114.
- Fasting blood glucose and health risks: American Diabetes Association. (2019). Fasting blood glucose and risk of cardiovascular disease and all-cause mortality: a review of cohort studies. Diabetes Care, 42(Supplement 1), S13-S22.