Blood Pressure After Exercise Chart

Track your post-exercise responses, manage hypertension effectively, and optimize cardiovascular health with our Blood Pressure After Exercise Chart.

By Joshua Napilay on Apr 08, 2024.

Fact Checked by Ericka Pingol.

Use Template

What is a Blood Pressure After Exercise Chart?

The blood pressure after exercise chart is a graphical representation of blood pressure measurements taken after physical activity. This chart is designed to illustrate how exercise affects blood pressure, providing a visual representation of the changes that occur post-exercise. 

The chart typically displays data points that reflect systolic and diastolic blood pressure values measured at different time intervals following a workout. It aims to help individuals, healthcare professionals, and fitness enthusiasts monitor and understand exercise's immediate and short-term impact on blood pressure. 

Regular physical activity is known to have positive effects on cardiovascular health, and monitoring blood pressure responses can be crucial in assessing the effectiveness of an exercise regimen or identifying any potential issues. Typically, the blood pressure after exercise chart will show a pattern of initial elevation in blood pressure during exercise, followed by a gradual decline as the body returns to its resting state. 

This decline is often more pronounced in individuals regularly engaged in cardiovascular training. The chart may also highlight variations in blood pressure response based on factors such as the intensity and duration of exercise, individual fitness levels, and any underlying health conditions.

Healthcare professionals may use these charts to tailor exercise prescriptions for patients with hypertension or other cardiovascular concerns. Additionally, individuals can use them to track their responses to exercise over time and make informed decisions about their fitness routines. 

Understanding how blood pressure reacts to physical activity is essential for maintaining heart health and preventing potential complications, making blood pressure after exercise charts valuable tools in promoting overall well-being.

Printable Blood Pressure After Exercise Chart

Download this chart to track your post-exercise responses, manage hypertension effectively, and optimize cardiovascular health.

How Does It Work?

1. Selecting the Chart

Begin by choosing a printable blood pressure after-exercise chart template. These are often available online and can be downloaded in formats like PDF or Excel.

2. Documenting Baseline Data

Before exercise, record baseline blood pressure measurements, including systolic and diastolic values. This establishes a reference point for comparison.

3. Pre-Exercise Information

Input details about the exercise session, such as the type, intensity, and duration. This helps in analyzing how different workouts impact blood pressure.

4. Time Intervals

Establish specific time intervals for post-exercise measurements. Common intervals may include immediately after exercise, 15 minutes, 30 minutes, and 60 minutes post-workout.

5. Recording Post-Exercise Blood Pressure

Measure and record post-exercise blood pressure values at each designated time interval. Note both systolic and diastolic readings accurately.

6. Observing Patterns

Analyze the chart for patterns or trends. Look for variations in blood pressure response based on exercise intensity, duration, and individual factors.

7. Identifying Abnormalities

Pay attention to any abnormal spikes or persistent elevations in blood pressure. Consult with a healthcare professional if there are concerns about the observed patterns.

8. Regular Monitoring

Use the chart as a tool for regular monitoring of blood pressure responses to exercise. This aids in assessing the effectiveness of the fitness routine and making necessary adjustments.

9. Customization for Health Goals

Tailor the chart to specific health goals or conditions. For individuals with hypertension, for example, customization may involve closer monitoring and stricter exercise guidelines.

10. Documentation for Consultation

Share the filled chart with healthcare providers during consultations if under medical supervision. This provides valuable insights into the individual's response to exercise.

11. Periodic Review and Updates

Periodically review and update the chart to reflect changes in exercise routines, overall health, or treatment plans. This ensures that the monitoring process remains relevant and practical.

Blood Pressure After Exercise Chart Example (Sample)

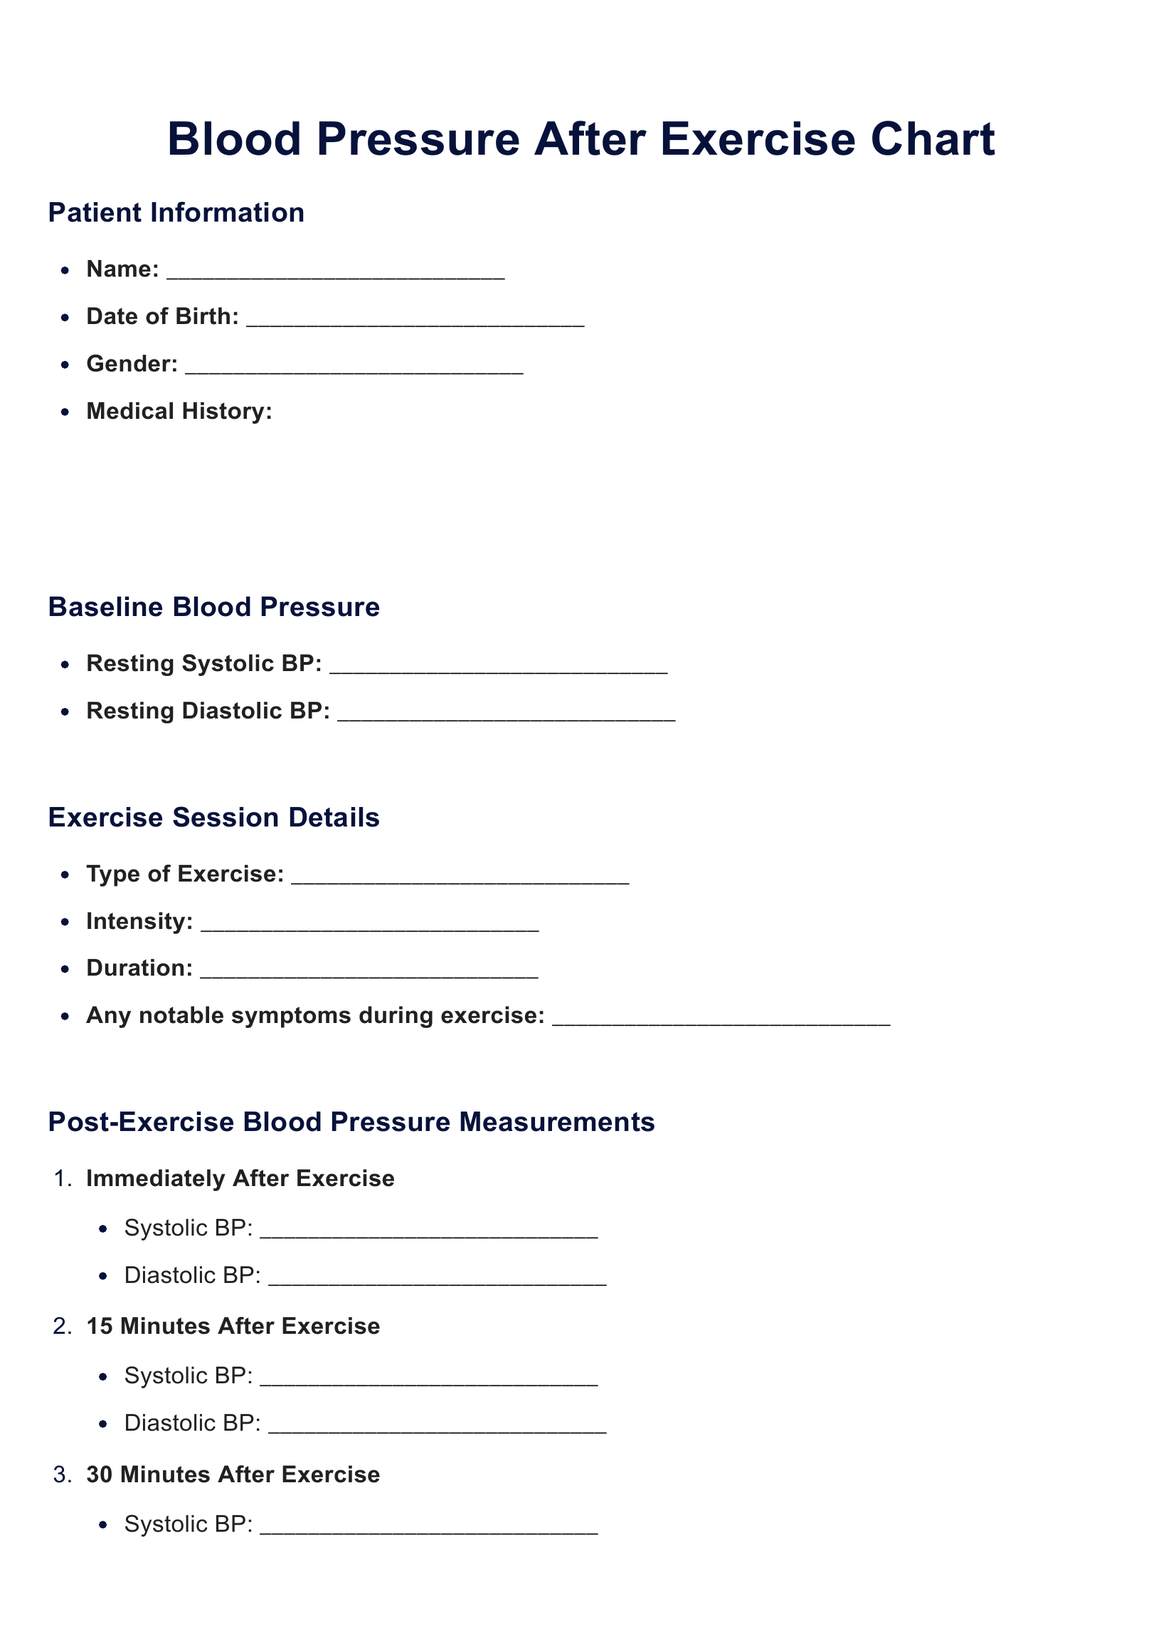
In this example of a Blood Pressure After Exercise Chart, we examine the case of John Doe, a male patient with controlled hypertension engaging in a 30-minute moderate-intensity aerobic exercise session. 

The baseline blood pressure measurements revealed a systolic reading of 130 mmHg and a diastolic reading of 80 mmHg. Post-exercise, immediate blood pressure increased to 140/85 mmHg, gradually declining over 60 minutes. 

Notably, John reported no adverse symptoms during or after the exercise, maintaining good hydration levels. The comprehensive chart, filled out by Dr. Smith, provides valuable insights into John's cardiovascular response to exercise, reinforcing the positive impact of regular physical activity on blood pressure regulation. 

This example, available as a Blood Pressure After Exercise Chart PDF, serves as a practical template for healthcare professionals to monitor and tailor exercise prescriptions based on individual responses to physical activity, contributing to effective hypertension management.

Blood Pressure After Exercise Chart Example (Sample)

When Would You Use This Chart?

The Blood Pressure After Exercise Chart proves to be a valuable resource in several scenarios, providing pertinent information for various practitioners and individuals interested in monitoring cardiovascular health. Here are instances when this chart would be handy:

  • Pre-Exercise Assessment: Before incorporating a new exercise regimen, fitness professionals can use the chart to assess baseline blood pressure and tailor workout plans based on individual responses to exercise.
  • Personal Training Monitoring: Personal trainers can utilize the chart to monitor clients' blood pressure changes during and after workouts, ensuring that exercise routines are well-tailored to their health status.
  • Hypertension Management: Healthcare practitioners, especially those managing hypertension, can employ the chart to monitor the immediate and short-term effects of exercise on blood pressure. This aids in adjusting medication and exercise prescriptions.
  • Cardiovascular Rehabilitation: For individuals recovering from cardiovascular events or surgery, the chart is a valuable tool in assessing the appropriateness and effectiveness of rehabilitation exercises.
  • Self-Monitoring: Individuals with hypertension or other cardiovascular conditions can use the chart for self-monitoring. It empowers them to understand how different exercises impact their blood pressure and make informed decisions about their fitness routines.
  • Goal Tracking: Those with specific fitness goals or health targets can use the chart to track progress. It provides a tangible record of cardiovascular responses to exercise, aiding in goal achievement.
  • Clinical Trials: Researchers studying the relationship between exercise and blood pressure can utilize the chart to gather valuable data. It offers a systematic way to document and analyze blood pressure responses in a controlled setting.
  • Corporate Wellness Initiatives: Companies implementing wellness programs can encourage employees to use the chart for health assessments. This promotes a proactive approach to cardiovascular health within the workforce.

Research & Evidence

Integrating Blood Pressure After Exercise Charts into cardiovascular health monitoring has roots in extensive research spanning decades (Forjaz et al., 1998). 

These studies, conducted in the mid-20th century, examined the acute effects of exercise on blood pressure, laying the foundation for understanding the interplay between physical activity and blood pressure regulation (Simpkins, 2013). 

Empirical support for post-exercise blood pressure monitoring comes from diverse sources, including clinical trials, observational studies, and meta-analyses (Mohammed et al., 2020). 

This body of research not only elucidates the physiological mechanisms of post-exercise hypotension but also highlights its benefits, particularly for individuals with hypertension. This evidence emphasizes the importance of real-time monitoring in tailoring exercise prescriptions to individual needs (Mastroianni, 2023).

The convergence of technology and wearable devices signifies a new era of precise and immediate cardiovascular health insights (Good Morning America, 2022). This technological integration enhances data accessibility, underlining the pivotal role of Blood Pressure After Exercise Charts in optimizing fitness interventions. 

These charts emerge as dynamic tools, providing immediate insights into cardiovascular responses and integral components in the broader landscape of personalized health and fitness management.

References

Forjaz, C. L. M., Matsudaira, Y., Rodrigues, F. B., Nunes, N., & Negrão, C. E. (1998). Post-exercise changes in blood pressure, heart rate, and rate pressure product at different exercise intensities in normotensive humans. Brazilian Journal of Medical and Biological Research, 31(10), 1247–1255. https://doi.org/10.1590/s0100-879x1998001000003

Good Morning America. (2022, March 31). Is it important to check blood pressure after exercise? [Video]. YouTube. https://www.youtube.com/watch?v=hpaZpMKiiVE

Mastroianni, B. (2023, June 1). Fitness experts share top workouts for people with high blood pressure. EverydayHealth.com. https://www.everydayhealth.com/hypertension/treatment/fitness-experts-share-top-workouts-people-with-high-blood-pressure/

Mohammed, L. L. M., Dhavale, M., Abdelaal, M. K., Alam, A., Blazin, T., Prajapati, D., & Mostafa, J. A. (2020). Exercise-Induced Hypertension in Healthy Individuals and Athletes: Is it an Alarming Sign? Cureus. https://doi.org/10.7759/cureus.11988

Simpkins, B. (2013, February 25). “Exercise hypertension” occurs when cells can’t “Relax,” Hopkins researchers find. https://www.hopkinsmedicine.org/Press_releases/2004/04_06a_04.html

Who typically requests a Blood Pressure After Exercise Chart?

Commonly asked questions

Who typically requests a Blood Pressure After Exercise Chart?

Individuals monitoring their cardiovascular health, fitness professionals guiding clients, and healthcare providers managing patients with hypertension or cardiovascular concerns commonly request a Blood Pressure After Exercise Chart.
When are Blood Pressure After Exercise Charts used?

Blood Pressure After Exercise Charts are used after physical activity sessions to monitor and analyze immediate and short-term blood pressure responses. They provide insights into the impact of exercise on cardiovascular health.

How are Blood Pressure After Exercise Charts used?

Users record baseline blood pressure, details of the exercise session, and post-exercise measurements at specified time intervals. The chart is a visual tool to observe blood pressure patterns, variations, and trends, aiding in fitness optimization and health assessment.

How long does a Blood Pressure After Exercise Chart take?

The time to complete a Blood Pressure After Exercise Chart varies based on individual needs and the frequency of monitoring. Typically, recording baseline data and post-exercise measurements can be done within a few minutes, making it a quick and efficient process for regular use.

Join 10,000+ teams using Carepatron to be more productive

One app for all your healthcare work