Normal Iron Level

Manage and interpret iron levels with ease using the Normal Iron Level Chart. It simplifies the assessment of iron status. Download now!

By Olivia Sayson on Apr 08, 2024.

Fact Checked by Ericka Pingol.

Use Template

What is a Normal Iron Level Chart?

A Normal Iron Level Chart is a medical resource designed to assist healthcare professionals and patients in monitoring and interpreting iron levels within the body. It serves as a structured template that organizes critical information related to iron, allowing for effective assessment and management of a patient's iron status.

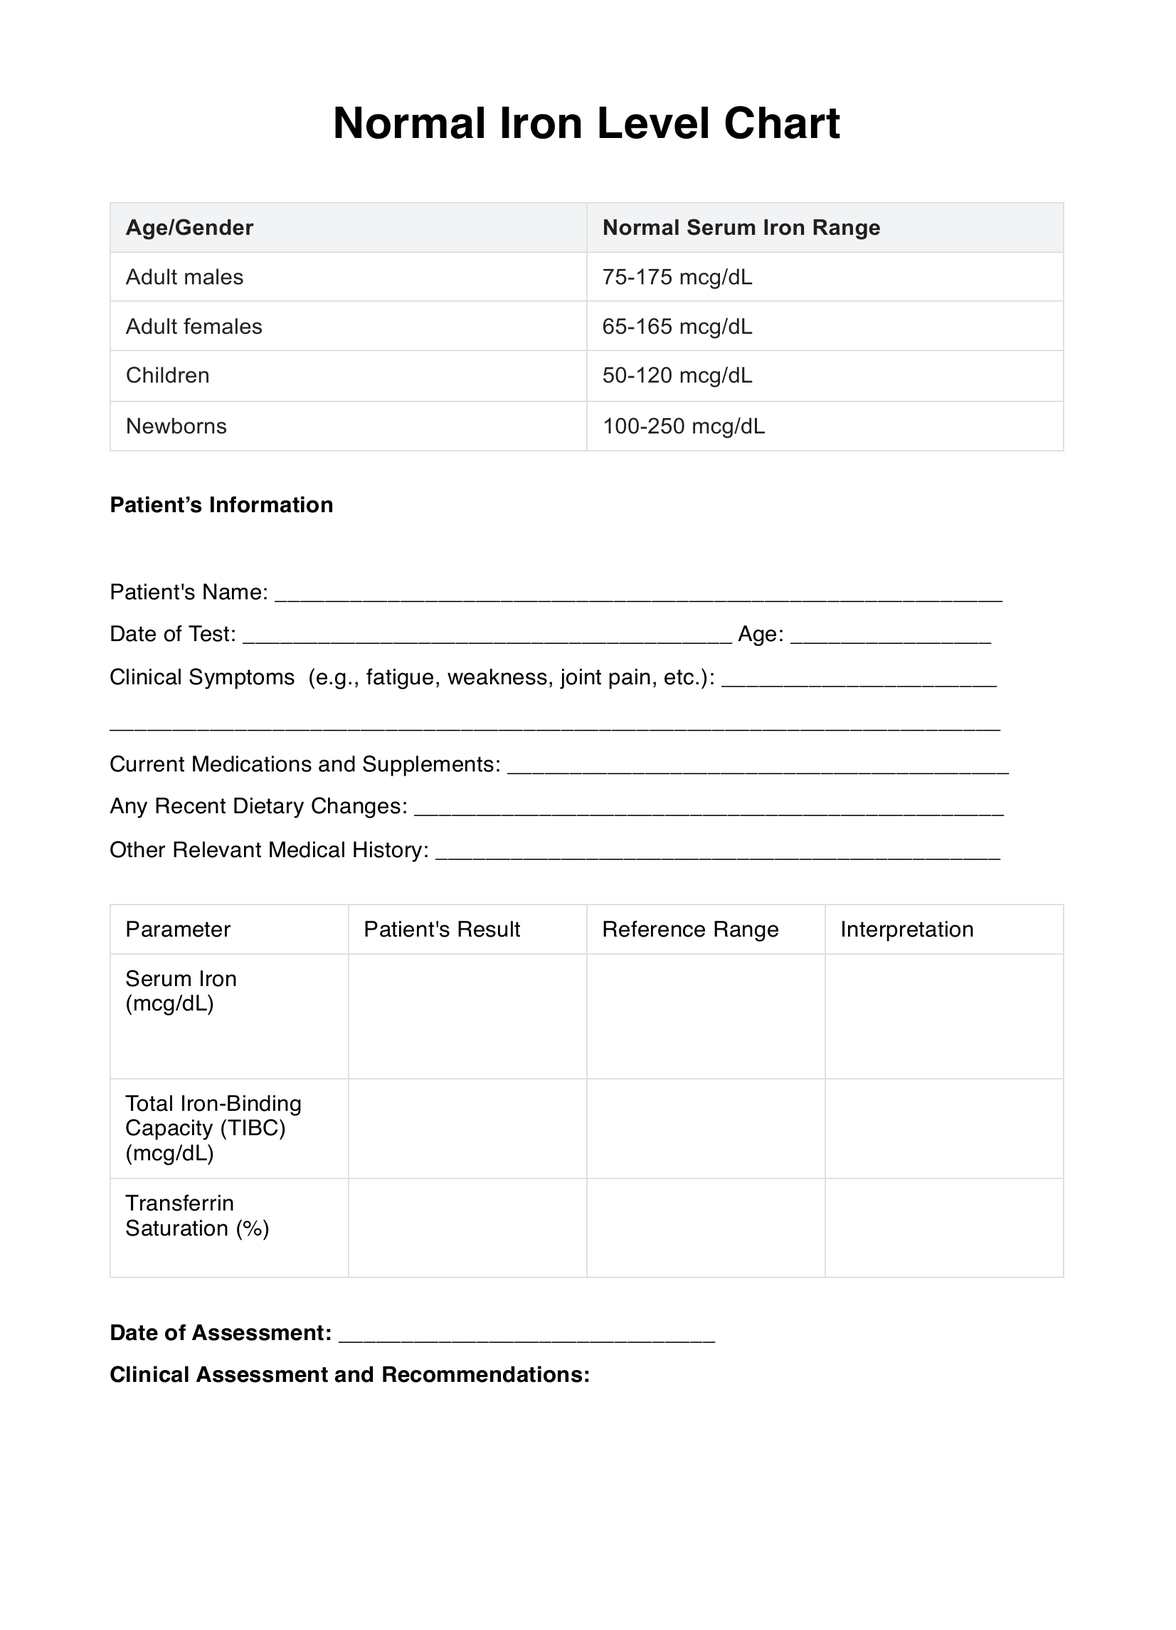
These Normal Iron Level Charts typically consist of sections for patient information, including name, age, and clinical history, as well as areas for recording specific iron-related parameters. These parameters include Serum Iron, Total Iron-Binding Capacity (TIBC), and Transferrin Saturation, each represented by corresponding columns where the patient's results can be documented. The chart also provides reference ranges and an interpretation section to help healthcare providers determine whether the patient's iron levels fall within normal parameters or if there are signs of deficiency or excess.

The Normal Iron Level Chart is a structured tool that simplifies tracking and assessing a patient's iron status, making it an essential resource for healthcare practitioners. It aids in the early detection of iron-related disorders, guides clinical decisions, and contributes to better patient care and overall health management.

Downloadable Normal Iron Level Range Chart

Check out our free Normal Iron Level Range Chart PDF

How Does it Work?

The Printable Normal Iron Level Chart is essential for monitoring and interpreting a patient's iron status. Here are five steps to effectively utilize this chart:

Step 1: Gather Patient Information

Begin by filling in the patient's details, including name, age, test date, clinical symptoms, current medications, dietary changes, and relevant medical history. Accurate data is crucial.

Step 2: Record Test Results

Input the patient's serum iron, total iron-binding capacity (TIBC), and transferrin saturation values in the respective columns. Ensure precision and adherence to units (mcg/dL).

Step 3: Reference Range Comparison

Compare the patient's test results with the provided reference ranges for each parameter. This step determines if the iron levels fall within the normal range.

Step 4: Interpretation 

Assess the interpretation column to determine whether the iron levels are normal or if they indicate a deficiency or excess. This helps guide further clinical assessments.

Step 5: Clinical Assessment and Recommendations 

Based on the chart data and interpretation, make clinical assessments and recommendations for the patient's health. Consider possible interventions or additional tests as needed.

Normal Iron Level Chart Example (Sample)

The Normal Iron Level Chart is a valuable resource for healthcare providers and patients. This comprehensive chart, available as a downloadable PDF, offers users a clear structure to record and interpret iron-related data. It aids in tracking serum iron, total iron-binding capacity, and transferrin saturation levels, ensuring a thorough iron profile assessment. 

The chart provides a standardized format for documenting patient information, test results, reference ranges, and interpretation. It guides healthcare professionals in making informed clinical assessments and recommendations regarding iron status. For patients, it enhances understanding of their iron levels and overall health. Take charge of your iron health – download the Normal Iron Level Chart PDF today!

Download our free Normal Iron Level Chart PDF here

When Would You Use This Chart?

The Normal Iron Level Chart is vital for healthcare practitioners, laboratory professionals, and patients to assess and monitor iron status effectively. Its primary application comes into play in various scenarios.

First and foremost, this chart is indispensable when evaluating patients with suspected iron-related conditions. When individuals present with clinical symptoms such as fatigue, weakness, joint pain, or other signs of anemia or iron imbalance, healthcare practitioners can utilize the Normal Iron Level Chart to document and interpret their iron profile. This allows for a systematic approach to diagnosing and managing these conditions.

Additionally, the chart is crucial during routine health check-ups. It enables practitioners to track patient iron level changes over time and ensure they remain within the optimal range. This can be particularly significant for individuals with chronic diseases, dietary restrictions, or those undergoing treatment for iron-related disorders.

Moreover, laboratory professionals find the Normal Iron Level Chart valuable when conducting iron panel tests and reporting results. It aids in maintaining consistency and clarity in recording patient data, reference ranges, and interpretations.

What do the Results Mean?

The Free Normal Iron Level Chart results provide crucial insights into an individual's iron status, helping to determine their overall health. Interpretation of these results is key to understanding the significance of the data.

The serum iron measurement represents the concentration of iron in the blood. Normal serum iron levels typically fall within the reference range, indicating that the body adequately stores and transports iron. Elevated serum iron can indicate excess iron intake, while low levels may suggest iron deficiency, leading to anemia and related symptoms like fatigue and weakness.

Meanwhile, the Total Iron-Binding Capacity (TIBC) reflects the body's capacity to bind and transport iron. A high TIBC can signify iron-deficiency anemia, as the body is trying to increase its iron-carrying capacity. Conversely, a low TIBC may suggest iron overload or hemochromatosis.

Lastly, the Transferrin Saturation percentage reveals how much of the available binding sites for iron on transferrin are occupied. Low transferrin saturation indicates an iron deficiency, while high levels may indicate iron overload.

Why Use Carepatron as Your Normal Iron Level App?

Carepatron is the top choice for handling your Normal Iron Level Chart with its advanced and comprehensive software. Whether you are a healthcare provider, counselor, therapist, or medical expert, it provides a tailored solution that makes it the ideal platform for managing such tasks.

One remarkable feature of Carepatron is its adaptability. It serves medical professionals and provides an integrated solution for counselors, life coaches, occupational therapists, and psychologists. This wide range of services includes GP practice management software, mental health EHR, practice management for psychologists, and occupational therapy EMR, allowing practitioners from various fields to manage patient or client data easily.

This Normal Iron Level Chart software offers a user-friendly interface for recording and understanding iron-related information. This simplifies keeping patient records, tracking results, and making clinical evaluations. The software also ensures data security and adherence to healthcare regulations, safeguarding important patient details.

EHR software benefit
Who typically requests a Normal Iron Level Chart?

Commonly asked questions

Who typically requests a Normal Iron Level Chart?

Healthcare providers, including doctors, nurses, and specialists, typically request this when assessing a patient's iron status.

When are Normal Iron Level Charts used?

These are used when healthcare professionals must evaluate a patient's iron levels, particularly in suspected anemia, iron deficiency, or iron overload.

‍How are Normal Iron Level Charts used?

These charts are used by entering patients' information, recording their test results, comparing them to reference ranges, and interpreting the data to assess their iron status.

How long does a Normal Iron Level Chart take?

The time it takes to complete can vary, but typically takes a few minutes to fill in patient details and record the test results during a medical appointment or lab visit. Interpretation and clinical assessment may take additional time.

Join 10,000+ teams using Carepatron to be more productive

One app for all your healthcare work