Understanding the cardiac cycle
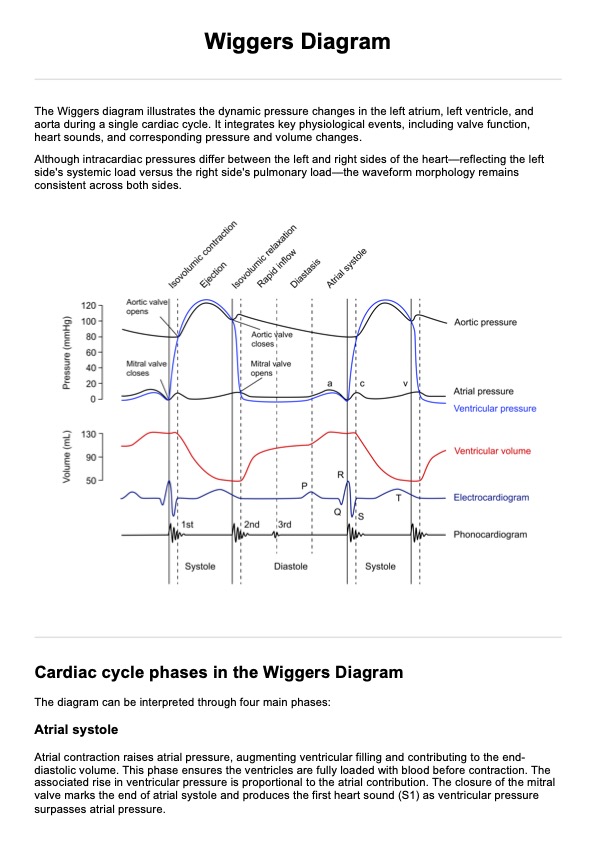
The cardiac cycle is a dynamic process involving the coordination of electrical, mechanical, and hemodynamic events to maintain blood flow and ensure efficient cardiac output. The Wiggers Diagram is an invaluable resource for visualizing this process, illustrating how changes in pressure, volume, and valve function are synchronized throughout the heart’s activity.
The role of atrial contraction
The cardiac cycle begins with the sinoatrial node, which initiates electrical impulses visible as the p wave on an ECG. This marks atrial contraction, where the atria contract to increase atrial pressure and contribute to ventricular end diastolic volume. During this phase, the mitral valve and tricuspid valve are open, allowing ventricular filling on both the right and left sides of the heart.
Ventricular depolarization and isovolumic contraction
Following atrial contraction, ventricular depolarization occurs, represented by the QRS complex. This signals the start of lv contraction and the phase of isovolumic contraction, where ventricular pressure increases rapidly without any change in lv volume. During this phase, all heart valves are closed, ensuring that the necessary pressure difference is established for effective ejection.
The ejection phase
As ventricular systole progresses, the aortic valve opens, initiating the ejection phase. Blood is ejected into the systemic circulation, causing aortic pressure to rise. The amount of blood ejected is quantified as the stroke volume, calculated by the difference between the end diastolic volume and the end systolic volume. This phase showcases the efficiency of the heart’s cardiac output in both healthy subjects and those with conditions like severe aortic stenosis.
Isovolumetric relaxation and early diastole
Once ejection is complete, the aortic valve closes, marking the beginning of isovolumetric relaxation. During this phase, ventricular relaxation occurs with no change in volume, as all valves remain shut. As ventricular pressure falls below atrial pressure, the mitral valve opens, restarting ventricular filling in early diastole. This phase ensures the heart is primed for the next cycle of blood flow.
Integrating cardiovascular physiology
The Wiggers Diagram provides a comprehensive overview of the cardiac cycle by linking mechanical events, such as aortic valve closure and ventricular filling, with physiological markers like heart rate and stroke volume. It is a critical tool for physiology education and cardiovascular pedagogy, offering insight into how the left ventricular and right and left sides of the heart function in unison.