


What is a Synovial Fluid Analysis Chart?
A Synovial Fluid Analysis Chart is a structured tool that organizes test results to evaluate joint health and identify causes of symptoms such as pain, swelling, or stiffness. It provides a comprehensive framework for recording and classifying a synovial fluid analysis's finding.
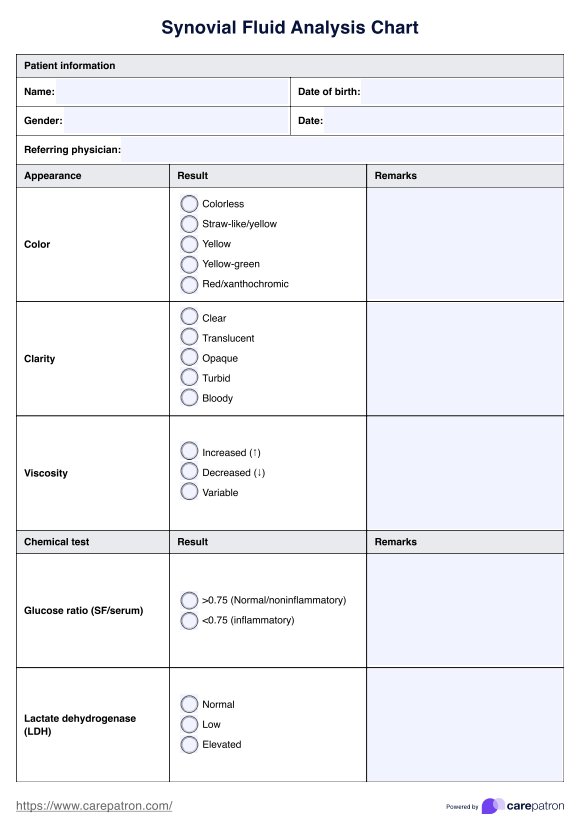
The chart includes sections for patient information, test results, and interpretations. Results cover key parameters such as appearance (color and clarity), chemical markers (glucose ratio, protein levels, lactate dehydrogenase), microscopic findings (white and red blood cell counts, neutrophil percentages, crystals), and infection markers (gram stain and culture). interpretation table aligns these findings with diagnostic categories, helping clinicians differentiate between conditions like gout, pseudogout, infections, or trauma. Overall, the chart simplifies complex data into actionable insights, providing space for a summary of results and additional notes to support effective diagnosis and treatment planning.


