What is a Sedimentation Rate Levels Chart?

A Sedimentation Rate Levels Chart is an essential diagnostic aid that maps the results of an erythrocyte sedimentation rate (ESR) test against established normal values. This test, colloquially known as the sed rate test, gauges the rate at which red blood cells settle in a test tube over a specified time, typically one hour. The faster the cells fall, the higher the sed rate, which can indicate inflammation, as it suggests a higher level of acute-phase reactants in the blood.
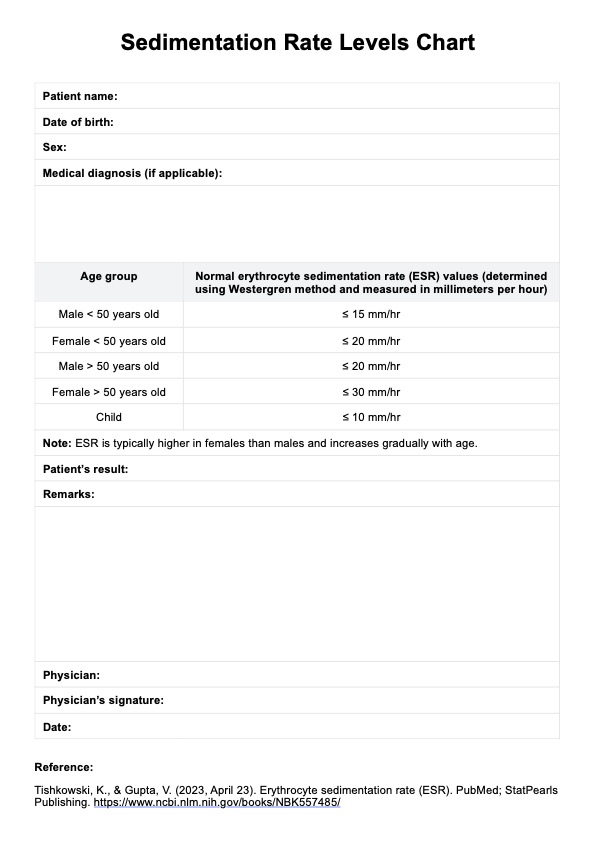
The chart is a comparative reference for medical practitioners, enabling them to assess whether a patient's sed rate falls within a normal range or indicates potential medical concerns. Normal ranges can vary based on age, sex, and measurement method. For instance, females may have slightly higher normal ESR values than males.

While the ESR test is not disease-specific, it is a valuable indicator of inflammation associated with various conditions, including infections, cancers, and autoimmune diseases. The Sedimentation Rate Levels Chart is particularly useful in tracking the progression or remission of disease over time and in monitoring the effectiveness of treatments.

In practice, the chart is straightforward: it lists the ESR value measured in millimeters per hour alongside corresponding normal ranges. A higher-than-normal sed rate may prompt further investigation to identify the cause of inflammation. However, it is important to note that a single ESR test is not definitive for diagnosis; it is typically used in conjunction with other tests and clinical evaluations to form a comprehensive picture of a patient's health.

Download our Sedimentation Rate Levels Chart for free

Check out our free Sedimentation Rate Levels Chart PDF here

How Does It Work?

The Sedimentation Rate Levels Chart is a straightforward yet vital tool in medical diagnostics, visually representing the erythrocyte sedimentation rate (ESR) test results. Here's how healthcare professionals typically use this chart:

Collection of the Blood Sample

A healthcare provider draws a blood sample from the patient, typically from a vein in the arm. This sample is then transferred into a standardized test tube used for the ESR test.

Initiation of the Sedimentation Process

Once the blood sample is placed in the tube, it's left undisturbed to sit vertically. A timer is set to track the sedimentation process, settling red blood cells (erythrocytes) to the bottom of the tube.

Measurement of the Sedimentation Rate

After one hour, the distance the red blood cells have descended is measured in millimeters from the top of the blood column. This measurement is the patient's ESR value.

Documentation on the Chart

The ESR value obtained is then recorded on the Sedimentation Rate Levels Chart. This printable chart allows for easy documentation and longitudinal tracking of patient results.

Comparison with Reference Values

The healthcare professional compares the patient's ESR value against the normal reference values indicated on the chart. These reference values are stratified by age and sex, as normal ESR levels can vary accordingly.

Interpretation of Results

The ESR value is interpreted in the context of the patient's overall clinical picture. Elevated levels may suggest inflammation or disease, while values within the normal range generally indicate the absence of acute inflammatory processes.

Utilization of a Printable Chart

Our printable Sedimentation Rate Levels Chart is particularly useful in clinical settings where electronic medical records are unavailable or for practitioners who prefer a physical record. It can be easily downloaded, printed, and filled out manually.

By following these steps, healthcare providers can effectively utilize the Sedimentation Rate Levels Chart to aid in diagnosing and monitoring conditions associated with inflammation. It's a key component in a suite of diagnostic tools and tests that collectively contribute to a comprehensive patient assessment.

Sedimentation Rate Levels Chart Example (Sample)

An example of a sedimentation rate levels chart would include:

  • Columns for the patient's name.
  • Date of the test.
  • The ESR value in millimeters per hour.

The chart may also have a reference range column indicating the normal sedimentation rate levels based on age and sex. For instance, a typical value might be 0-20 mm/hr for men and 0-30 mm/hr for women. The chart simplifies tracking changes over time and can be downloaded as a Sedimentation Rate Levels Chart PDF from our website.

Check out our free Sedimentation Rate Levels Chart PDF here

When Would You Use This Chart?

Here are some of the key situations when this Sedimentation Rate Levels Chart is most appropriately utilized:

  • Clinical Suspicion of Inflammatory Conditions: When patients exhibit symptoms such as unexplained fever, chronic fatigue, or muscle pain, which could indicate underlying inflammatory disorders like rheumatoid arthritis or temporal arteritis, the chart helps assess the severity of inflammation.
  • Monitoring Disease Progression: For chronic inflammatory conditions, such as systemic lupus erythematosus or polymyalgia rheumatica, the chart is used over time to track the disease's progression or remission.
  • Evaluating Treatment Response: In patients undergoing treatment for inflammatory diseases, periodic ESR tests and subsequent charting provide insights into the treatment's effectiveness, helping guide adjustments in therapeutic approaches.
  • Differentiating Between Conditions: The Sedimentation Rate Levels Chart can help differentiate between inflammatory and non-inflammatory conditions, as a high ESR is more common in the former.
  • Preoperative Assessment: Before surgery, this chart can be part of the preoperative workup to identify any hidden infections or inflammatory conditions that could affect surgical outcomes.
  • Screening in At-Risk Populations: In older adults or those with a family history of autoimmune diseases, the chart may be used as a routine screening to catch early signs of inflammation.
  • Complementing Other Diagnostic Tests: The ESR test is often ordered alongside other blood tests, such as C-reactive protein (CRP), to provide a more comprehensive picture of the body's inflammatory state.
  • Guiding Further Testing: An abnormal result on the chart may prompt further diagnostic testing, such as imaging or biopsies, to pinpoint the cause of the inflammation.

The Sedimentation Rate Levels Chart is a valuable resource for many healthcare professionals, including rheumatologists, general practitioners, internists, and laboratory personnel. It is particularly beneficial when a quick and non-specific assessment of inflammation is required. 

By incorporating this chart into patient evaluations, healthcare providers can make more informed decisions about diagnosis, treatment plans, and patient management strategies.

EHR software feedback

What Do the Results Mean?

Understanding the results of an Erythrocyte Sedimentation Rate (ESR) test is crucial for healthcare providers and patients. The Sedimentation Rate Levels Chart serves as a guide to interpret these results. Here's what the common readings might indicate:

  • Normal Range: A low or normal ESR suggests no significant inflammation in the body. This result is typically expected in healthy individuals without symptoms of inflammatory conditions.
  • Mildly Elevated Levels: A slight increase in ESR might be a transient response to an infection or a minor injury and may not always signify a chronic inflammatory condition. It could also reflect an acute phase reactant response, where levels rise temporarily due to illness or stress.
  • Moderately Elevated Levels: This range may suggest chronic inflammation and could be associated with anemia, pregnancy, or thyroid disease. It may also indicate the early stages of an inflammatory or autoimmune disorder.
  • Highly Elevated Levels: A significantly high ESR is a strong indicator of active inflammation, infection, or other medical conditions such as autoimmune diseases, certain cancers, or advanced kidney disease. This elevation level usually requires a thorough investigation to determine the underlying cause.
  • Persistently Elevated Levels: If the ESR remains high over consecutive tests, it may indicate an ongoing inflammatory process or a poor response to a treatment regimen.
  • Decreasing Levels: A downward trend in ESR values on subsequent tests may suggest a positive response to treatment in patients with known inflammatory conditions.

It's important to remember that the ESR is a non-specific test and must be interpreted in the context of the patient's overall clinical picture, including symptoms, physical examination findings, and other laboratory results. 

Our free Sedimentation Rate Levels Chart can be a practical tool for tracking changes in ESR over time, providing a visual representation of trends that can inform clinical decisions. However, it should not be used in isolation to diagnose or rule out disease. Additional tests and clinical correlation are often necessary to assess a patient's health status comprehensively.

Why Use Carepatron as Your Sedimentation Rate Levels App?

Carepatron's Sedimentation Rate Levels Chart app stands out as an essential tool for healthcare providers, offering a blend of simplicity and compliance with global security standards like HIPAA, GDPR, and HITRUST. Its user-friendly interface requires no complex training, allowing practitioners to integrate it effortlessly into their daily routines and focus on delivering patient care.

The platform excels in collaborative healthcare delivery, enabling seamless information sharing across teams and networks. This fosters a unified treatment approach for in-person and telehealth services. Carepatron's commitment to security and collaboration makes it a trusted name in global healthcare practice management.

Key features of Carepatron include:

  • Efficient Tracking: The app's software allows for meticulous tracking and analysis of ESR levels, with capabilities to compare and visualize patient data over time.
  • Integrated Management Solutions: From mental health to physical therapy, and clinical notes, Carepatron offers tailored solutions that cater to the unique needs of various healthcare sectors.
  • Telehealth Capabilities: The telehealth platform ensures patient care extends beyond the clinic, providing secure and convenient virtual care options.
  • All-in-One Software: The comprehensive practice management software integrates all facets of patient care, streamlining intake and follow-up processes.

Carepatron equips healthcare practitioners with cutting-edge management technology, ensuring patient care is efficient, secure, and collaborative. It's not just software; it's a partner in enhancing clinical outcomes.

EHR software benefit

References

Miller, A., Green, M., & Robinson, D. (1983). Simple rule for calculating normal erythrocyte sedimentation rate. British Medical Journal (Clinical Research Ed.), 286(6361), 266. https://doi.org/10.1136/bmj.286.6361.266 

Westergren, A. (1921). The technique of the red cell sedimentation reaction. American Journal of the Medical Sciences, 162, 622-630.

Wolfe, F., & Michaud, K. (2006). The clinical and research significance of the erythrocyte sedimentation rate. Journal of Rheumatology, 33(7), 1188-1195.

Who typically requests a Sedimentation Rate Levels Chart?

Commonly asked questions

Who typically requests a Sedimentation Rate Levels Chart?

Primary care physicians, rheumatologists, and other specialists may request an ESR test to help diagnose inflammation-related conditions.

When are Sedimentation Rate Levels Charts used?

Sedimentation Rate Levels Charts are used when symptoms suggest conditions like arthritis, vasculitis, or inflammatory bowel disease and to monitor the activity of these conditions.

How are Sedimentation Rate Levels Charts used?

Sedimentation Rate Levels Charts are used to record and compare ESR results with normal ranges to assess the presence and severity of inflammation.

How long does a Sedimentation Rate Levels Chart take?

The ESR test itself takes about an hour, and the results can be charted immediately afterward.

Join 10,000+ teams using Carepatron to be more productive

One app for all your healthcare work