


What is a Lab Values Chart?
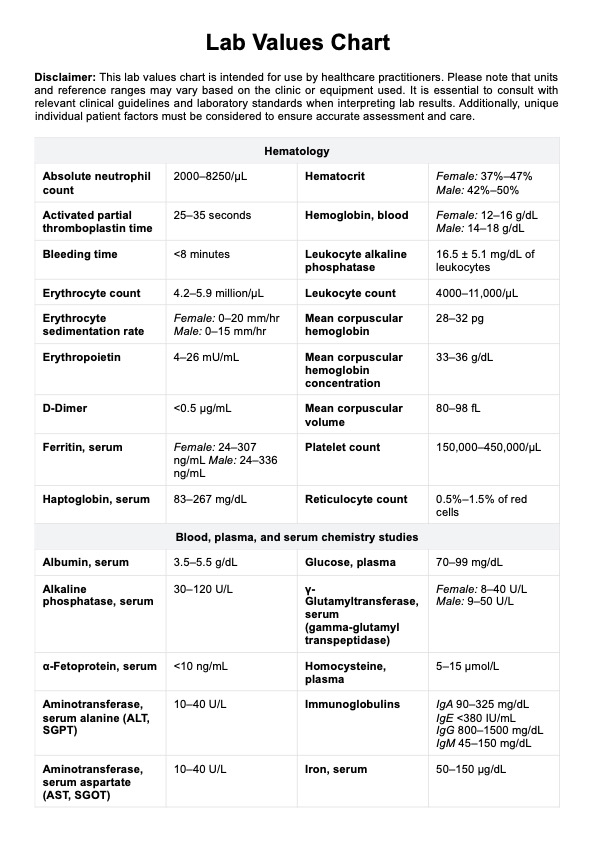
A Lab Values Chart is a critical reference document in the medical field that lists the normal laboratory values for different tests and indicators. Healthcare providers use these charts to interpret a patient's lab results, including measurements of enzymes, hormones, blood cells, and other biochemical entities within bodily fluids. The chart is a benchmark for identifying normal health parameters and potential deviations that may signal underlying health issues.
For instance, a Lab Values Chart will detail the expected range of red blood cells, white blood cells, and platelets in a complete blood count (CBC) or glucose and electrolytes in a basic metabolic panel (BMP). It also includes reference values for more specialized tests, such as liver or thyroid function tests, which are vital for diagnosing and managing specific conditions.
These charts are also dynamic, and units or values can vary across different laboratories. They are regularly updated as new research emerges, and the understanding of health markers evolves. They also account for patient-specific factors, such as age or gender, which can influence what is considered 'normal.'
In educational settings, a Lab Values Chart is an indispensable tool for students learning about the human body's complex biochemistry and how it's assessed through laboratory tests. In practice, a printable or digital Lab Values Chart is often available for quick reference during patient consultations or lab report reviews.


