Fasting Blood Sugar Levels

Use the Fasting Blood Sugar Levels Chart to monitor and control health. Understand blood sugar levels and make informed decisions.

By Olivia Sayson on Apr 08, 2024.

Fact Checked by Ericka Pingol.

Use Template

What Is A Fasting Blood Sugar Levels Chart?

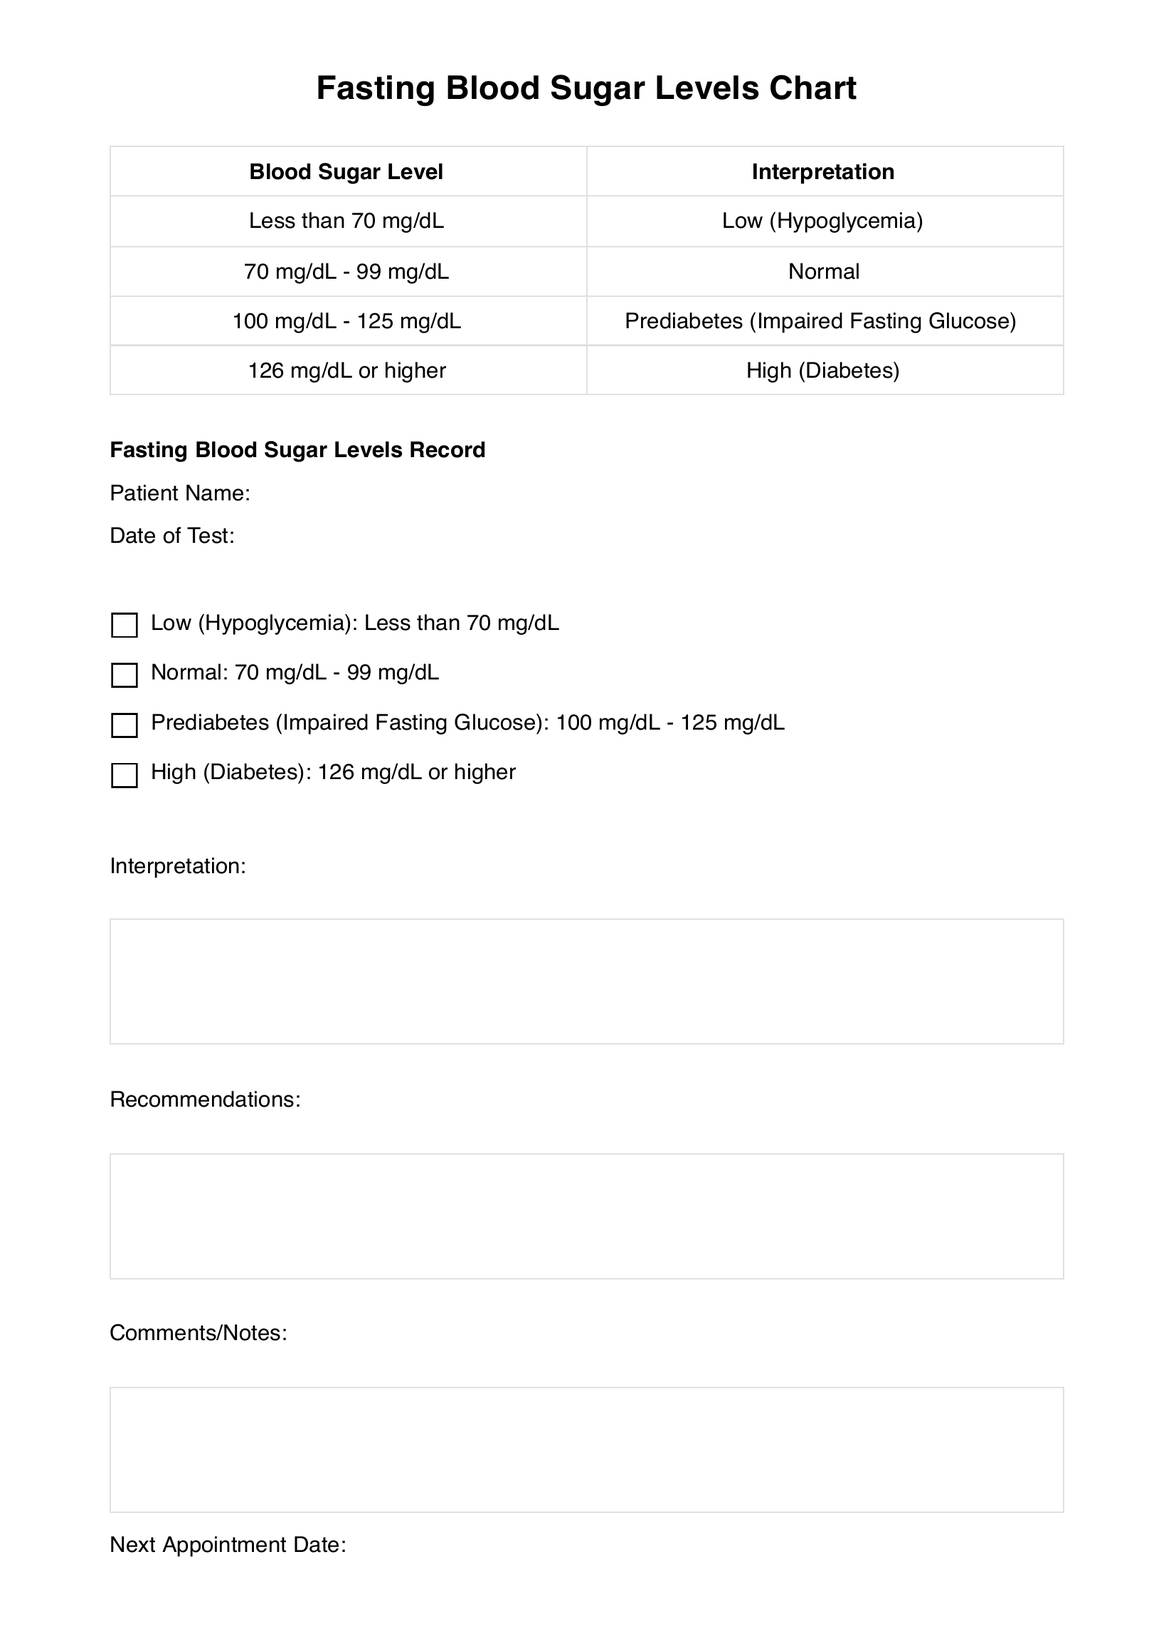
Fasting Blood Sugar Levels Charts are designed to assist individuals in understanding and monitoring their blood sugar readings. This chart is a visual guide, clearly interpreting blood sugar levels, typically measured after an overnight fast. It categorizes these levels into four distinct ranges: "Low (Hypoglycemia)," "Normal," "Prediabetes (Impaired Fasting Glucose)," and "High (Diabetes)."

The chart is essential for those concerned about their blood sugar health. The chart allows individuals to easily assess their fasting blood sugar levels and gain insights into their overall well-being. Understanding where their blood sugar falls within these ranges enables informed decision-making about potential lifestyle adjustments, dietary choices, or the need for medical attention.

Whether proactively managing one's health or managing a known condition like diabetes, the Fasting Blood Sugar Levels Chart provides a user-friendly reference point for tracking, interpreting, and responding to blood sugar fluctuations. It is a practical resource that empowers individuals to take charge of their health, helping them make informed choices to maintain or improve their overall health and well-being.

Printable Fasting Blood Sugar Levels Chart

Download this Fasting Blood Sugar Levels Chart to help clients understand and monitor their blood sugar readings.

How Does it Work?

Step 1: Gather Necessary Information

Begin by obtaining a Printable Fasting Blood Sugar Levels Chart and ensure it contains essential patient details, including name and date of birth. Verify the test date, crucial for tracking the patient's blood sugar trends over time.

Step 2: Interpret the Results

Examine the patient's blood sugar reading in the chart. Interpret the value as "Low (Hypoglycemia)," "Normal," "Prediabetes (Impaired Fasting Glucose)," or "High (Diabetes)" based on the chart's guidelines. Understand the implications of each interpretation.

Step 3: Offer Recommendations

Provide recommendations based on the interpretation. For "Low (Hypoglycemia)," suggest steps to raise blood sugar levels. For "High (Diabetes)," advise immediate medical attention. For "Prediabetes," guide patients on lifestyle changes. Document these recommendations in the chart.

Step 4: Note Comments and Schedule Follow-Up

Use the Comments/Notes section to record relevant observations or patient information. Encourage the patient to schedule their next appointment and record the date for follow-up. The chart is a valuable tool for tracking blood sugar history and guiding patient care effectively.

Fasting Blood Sugar Levels Chart Example (Sample)

The Fasting Blood Sugar Levels Chart Example, available in PDF format as the "Fasting Blood Sugar Levels Chart PDF," is a user-friendly tool that empowers individuals to monitor and interpret their blood sugar levels accurately. This comprehensive chart provides clear interpretations of low, normal, prediabetic, and diabetic blood sugar ranges, offering users invaluable insights into their health.

Users can easily download and print this PDF chart, making it accessible for daily use and reference. It simplifies tracking blood sugar readings, clarifies health implications, and guides users on necessary actions.

The chart fosters proactive healthcare management, promoting healthier lifestyles and early intervention. To take control of your health, download the Fasting Blood Sugar Levels Chart PDF now and stay on top of your blood sugar levels.

Download this Fasting Blood Sugar Levels Chart Example: 

When Would You Use This Chart?

The Fasting Blood Sugar Levels Chart is a versatile resource with broad applicability. It is used by individuals with diabetes for daily monitoring, helping them maintain their blood sugar within the target range. Healthcare providers often recommend it during routine check-ups, especially when diabetes or prediabetes is a concern. 

Nutritionists and dietitians employ the chart to educate clients on the dietary impact on blood sugar, suggesting lifestyle changes accordingly. Endocrinologists utilize the chart to assess patient progress and treatment plans. Health educators use it in workshops focused on diabetes prevention and management, equipping attendees with a practical tool for self-monitoring. 

The Fasting Blood Sugar Levels Chart is an essential resource in these contexts, fostering proactive health management, informed decision-making, and improved health outcomes.

What do the Results Mean?

Interpreting the results on a Free Fasting Blood Sugar Levels Chart is essential for understanding your blood sugar health. Common results fall into four categories:

Low (Hypoglycemia): This category indicates blood sugar levels below 70 mg/dL. It can lead to symptoms like dizziness and sweating, often requiring quick-acting carbohydrates.

Normal: Falling within 70 mg/dL to 99 mg/dL is considered normal, indicating healthy blood sugar levels and a lower risk of diabetes.

Prediabetes (Impaired Fasting Glucose): Results between 100 mg/dL and 125 mg/dL suggest an increased risk of developing diabetes, emphasizing the need for lifestyle changes.

High (Diabetes): 126 mg/dL or higher reading signifies diabetes. Immediate consultation with a healthcare professional is necessary to begin a suitable management plan.

Understanding these common results empowers individuals to assess their blood sugar health and take appropriate actions, whether it's a quick intervention for low blood sugar, maintaining healthy levels, or addressing prediabetes and diabetes through lifestyle changes and medical guidance. Regular monitoring is a valuable tool for long-term health management.

Why Use Carepatron As Your Fasting Blood Sugar Levels App?

Utilizing Carepatron as your Fasting Blood Sugar Levels Chart app is the best decision for several compelling reasons. It offers a versatile and comprehensive platform for managing various aspects of healthcare, making it the go-to solution for tracking and interpreting blood sugar levels. 

Whether you're a patient or a healthcare provider, it offers fasting blood sugar chart software that seamlessly integrates into its suite of tools. From physical therapy EMR to therapy practice management software, clinical notes software, and a telehealth platform, it simplifies the management of healthcare data and processes. It provides a holistic approach, enabling healthcare professionals to streamline patient care while patients can effortlessly monitor and interpret their fasting blood sugar levels in the context of their broader health records. 

Carepatron's practice management software enhances patient care, efficiency, and healthcare experience. You're not just accessing a fasting blood sugar levels app; you're tapping into a robust healthcare management ecosystem that enhances both patient and provider experiences.

Clinical Documentation Software

References

  • Association Between Fasting Blood Glucose and All-Cause Mortality in a Rural Chinese Population: 15-Year Follow-Up Cohort Study (2021) by Xu et al., published in Diabetes Therapy
  • Correlation of fasting and postprandial plasma glucose with HbA1c in assessing glycemic control; systematic review and meta-analysis (2015) by Shrestha et al., published in Archives of Public Health
  • Fasting with diabetes: a prospective observational study (2020) by Yau et al., published in BMJ Global Health
  • Diabetes: Diagnosis and Treatment (2023), published by the Mayo Clinic
Who typically requests a Fasting Blood Sugar Levels Chart?

Commonly asked questions

Who typically requests a Fasting Blood Sugar Levels Chart?

These are typically requested by healthcare providers, including doctors and nurses, for patients who need to monitor and manage their blood sugar levels, especially those with diabetes.

When are Fasting Blood Sugar Levels Charts used?

The charts are used when individuals need to track their blood sugar levels regularly. They are particularly valuable in managing diabetes, making dietary adjustments, or assessing overall health.

How are Fasting Blood Sugar Levels Charts used?

These are used by recording daily fasting blood sugar readings, interpreting the results, and implementing necessary actions, such as adjusting diet or medication, as guided by healthcare professionals.

Join 10,000+ teams using Carepatron to be more productive

One app for all your healthcare work